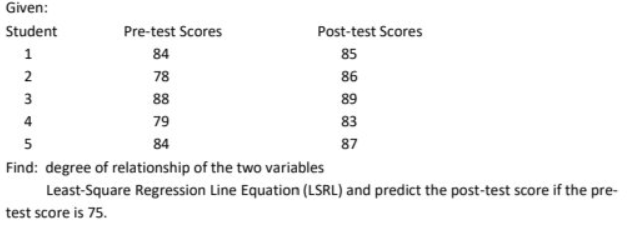
Given: Student Pre-test Scores Post-test Scores 1 84 85 2 78 86 ITT 3 88 89 4 79 83 5 84 87 Find: degree of relationship of the two variables Least-Square Regression Line Equation (LSRL) and predict the post-test score if the pre- test score is 75.


Q: No 72
A: The objective is to define the discrete and continuous data from the given experiment, where the…
Q: The commercial for the new Meat Man Barbecue claims that it takes 13 minutes for assembly. A…
A: The hypothesized mean is 13.
Q: The consumption function captures one of the key relationships in economics. It expresses…
A: Note that I used Excel software for my calculations.
Q: What is the probably of observing a difference in sample means less than 0.5?
A: here given , Assume the same population of nurses from CR hospital with the same mean and standard…
Q: In December 2004, 43% of students in high school were satisfied with the lunches supplied through…
A:
Q: Because of practical considerations you ultimately decide to survey 100 people and find that 75 of…
A: Solution-: Number of people in survey =100 Number of people prefer to work at home = 75 We want to…
Q: In a sample of 5 courses with no support course the average final of 200 students was 70% with a…
A: Question 1 Given, sample size (n) = 200 standard deviation (σ) = 10 sample mean (x̄) = 70…
Q: * Q1) a- if the percentage infection of a disease in a country was 0.005. Thus, using binomial…
A: The question is based on binomial prob. dist. Given : % infection of disease in a country ( p ) =…
Q: a) Write out this regression equation. b) Test for the statistical significance of each explanatory…
A: Here we have to given that the sample size = 124 ( i.e. included observation ) and we have to also…
Q: The Jones family was one of the first to come to the U.S. They had 7 children. Assuming that the…
A: It is given that n=7 and p=0.5.
Q: A manufacturer has developed a new fishing line, which the company claims has a mean breaking…
A: Given that: Population mean, μ=15 Population standard deviation, σ=0.5 Null and alternative…
Q: Find the 90% confidence interval. Enter your answer as an open-interval (i.e., parentheses) accurate…
A: Given sample temperature in degrees Fahrenheit
Q: b- for the following data, (19, 32, 26, 71, 88, 45, 59), the Harmonic Mean (H) is 37.4406 O 37.6044…
A: To find: The harmonic mean
Q: What about the t value and the p value?
A:
Q: A distribution of values is normal with a mean of 116.2 and a standard deviation of 60.1. Find P43,…
A:
Q: (a) A random sample of 10 houses in a particular area, each of which is heated with natural gas, is…
A: Since you have posted a question with multiple sub-parts, we will solve first three subparts for…
Q: normal distribution has a mean of 17 and a standard deviation of 5. Use the 68-95-99.7 rule to find…
A: mean = 17 and standard deviation = 5 Normal distribution Use empirical rule P(17<x<27) =?
Q: Determine the mean of X.Determine the mean of Y Determine the variance of X. Determine the…
A:
Q: You must estimate the mean temperature (in degrees Fahrenheit) with the following sample…
A: We are given sample temperatures, we need to find 98% confidence interval.
Q: At a= 0.05, is there a significant difference on your sample average price if the market average…
A: Given: Significance level α=0.05 The hypothesized value of the population mean is 40 H0: µ=40 H1: µ…
Q: Suppose that in a random selection of 100 colored candies, 22% of them are blue. The candy company…
A: The hypothesized proportion is 0.3.
Q: A poll was conducted to investigate opinions about global warming. The respondents who answered yes…
A:
Q: Choose the correct answer 1- Example for Positive correlation is A) Income and expenditure B) Price…
A: Note: According to Bartleby guidelines expert solve only one question and maximum 3 subpart of the…
Q: our place of employment is trying to determine whether to allow its employees to work from home for…
A: Note: As per the multiple questions rule, we are answering first question for you. Kindly repost the…
Q: Tests of Between-Subjects Effects Mean Square Dependent Variable: Game Score Type Sum Source of…
A: The objective to determine whether there is a significant main effect of sex at significance level…
Q: A union of restaurant and foodservice workers would like to estimate the mean hourly wage, μ, of…
A: A) The hypothesized mean is 8.16.
Q: Due to random variations in the operation of an automatic coffee machine, not every cop is filled…
A: Mean (μ)=9 Standard deviation (σ)=0.6
Q: A simple random sample of 41 Veterans Day celebrations was selected and the number of children…
A: (14) Obtain the 98% confidence interval for the mean number of children attending all 2017 Veterans…
Q: (a) Identify the null hypothesis and alternative hypothesis. OA. Ho: μ#3.1 H₂: H=3.1 OD. Ho: H≤3.2…
A:
Q: (c) Use the data in part (a) to estimate p, the proportion of all houses that used at least 100…
A: Solution Given That, A random sample of 10 houses in a particular area, each of which is heated with…
Q: What is the critical value needed to compute the margin of error for a confidence interval for μ…
A: Given: Confidence level = 95% = 0.95 Significance level α = 1-0.95 α = 0.05
Q: According to the study, the average number of hours that the student spent studying per week in the…
A: From the provided information, Mean (µ) = 56 hours Standard deviation (σ) = 14 hours X~N (56, 14)
Q: A police department released the numbers of calls for the different days of the week during the…
A:
Q: a)what is the Pearson correlation value between income and consumption?
A: formula r=n(Σxy)-(Σx)(Σy)nΣx2-(Σx)2nΣy2-(Σy2)
Q: Use the sample information x¯x¯ = 43, σ = 6, n = 13 to calculate the following confidence intervals…
A:
Q: Assume that a sample is used to estimate a population mean μμ. Find the margin of error M.E. that…
A: Givensample size(n)=14Mean(x)=42.4standard deviation(s)=12.5confidence level=90%
Q: Rockwell hardness of pins of a certain type is known to have a mean value of 50 and a standard…
A: We have given that Mean(μ) = 50 Standard Deviation = σ = 1.4
Q: √x² +²23,0 < x < 1,0 < y < 2, f(x, y) = elsewhere. 0, b. g(x) = 2x (x + 1/3), h(y) = 1/3 + y/6. a.…
A: E(XY)=∫y∫xxy.f(x,y)dxdy
Q: If the probability distribution of a continuous random variable that has values between y = 1 and 3…
A:
Q: Finish times to the nearest hour for dogsled teams are shown below. Find the class width. Use 5…
A: The following data has been provided: 243 255 314 312 326 355 357 238 307 298 The total number of…
Q: Find the P-value for a left-tailed hypothesis test with a test statistic of z= -1.17. Decide whether…
A: Given data: Test statistic: Z = -1.17 Significance level = 0.10 Left tailed test To find: P value…
Q: The number of customers served at a busy restaurant on Thursdays follows a Normal distribution with…
A: The mean is 6352 and the standard deviation is 254.
Q: A university department chair believes that the afternoon section of a large survey class has a…
A: The answer is attached below,
Q: f(x, y) 2 4 1 0.10 0.15 Y 3 0.20 0.30 5 0.10 0.15 a. Determine the marginal distribution g(x), x =…
A: Farmula used P(X/Y=y)=P(X,Y=y)/P(Y=y)
Q: An experiment consists of observing the sum of the outcomes when two fair dice are thrown. Find (a)…
A: Given An experiment consists of observing the sum of the outcomes when two fair dice are thrown.
Q: explanation needed. Rate will be given! Multiple Choice In a box containing 8 red balls, 8 green…
A:
Q: a lot has 10% defective items. ten items are chosen randomly. the proability that exactly 2 of the…
A:
Q: Hypothesis test for the difference between two population proportions Jump to level 1 A city council…
A:
Q: Suppose the mean number of people attending all 2017 Veterans Day celebrations held in Virginia is…
A: Given that: Mean number of people attending all 2017 veterans day celebrations held in Virginia,…
Q: Based on the information, what is the cumulative relative frequency for the 50.2% - 59.7% change in…
A: It is given that Cumulative frequency for class 50.2-59.7 is = 45 Total frequency = 50

Step by step
Solved in 2 steps with 2 images

- Which of the multivariate regression parameters listed below would be best interpreted as: the predicted value on the dependent variable when all of the independent variables in the model are equal to zero. a b1 X1 R2For a multiple regression model, SSR = 600 and SSE = 200. The multiple coefficient of determination isA ski resort asked a random sample of guests to rate their satisfaction on various attributes of their visit on a scale of 1–5 with 1 = very unsatisfied and 5 = very satisfied. The estimated regression model was Y = overall satisfaction score, X1 = lift line wait, X2 = amount of ski trail grooming, X3 = safety patrol visibility, and X4 = friendliness of guest services. Predictor Coefficient Intercept 2.7115 LiftWait 0.1474 AmountGroomed 0.2517 SkiPatrolVisibility 0.0656 FriendlinessHosts −0.1172 (a) Write the fitted regression equation. (Round your answers to 4 decimal places. Negative values should be indicated by a minus sign.) yˆy^ = ?? + ?? * LiftWait + ?? * AmountGroomed + ?? * SkiPatrolVisibility + ?? * FriendlinessHosts (b) Interpret each coefficient. Overall satisfaction increases Correctwith an increase in satisfaction for each individual predictor except for friendliness of hosts.(c) Would the intercept seem to have meaning in this…
- A ski resort asked a random sample of guests to rate their satisfaction on various attributes of their visit on a scale of 1–5 with 1 = very unsatisfied and 5 = very satisfied. The estimated regression model was Y = overall satisfaction score, X1 = lift line wait, X2 = amount of ski trail grooming, X3 = safety patrol visibility, and X4 = friendliness of guest services. Predictor Coefficient Intercept 2.9833 LiftWait 0.1458 AmountGroomed 0.2562 SkiPatrolVisibility 0.0428 FriendlinessHosts −0.1298 (a) Write the fitted regression equation. (Round your answers to 4 decimal places. Negative values should be indicated by a minus sign.) yˆy^ = + * LiftWait + * AmountGroomed + * SkiPatrolVisibility + * FriendlinessHosts (b) Interpret each coefficient. Overall satisfaction increases with an increase in satisfaction for each individual predictor except for friendliness of hosts. (d) Make a prediction for Overall Satisfaction when a guest’s satisfaction in…A ski resort asked a random sample of guests to rate their satisfaction on various attributes of their visit on a scale of 1–5 with 1 = very unsatisfied and 5 = very satisfied. The estimated regression model was Y = overall satisfaction score, X1 = lift line wait, X2 = amount of ski trail grooming, X3 = safety patrol visibility, and X4 = friendliness of guest services. Predictor Coefficient Intercept 2.9018 LiftWait 0.1642 AmountGroomed 0.2343 SkiPatrolVisibility 0.0602 FriendlinessHosts −0.1193 (a) Write the fitted regression equation. (Round your answers to 4 decimal places. Negative values should be indicated by a minus sign.) yˆy^ = + * LiftWait + * AmountGroomed + * SkiPatrolVisibility + * FriendlinessHosts (b) Interpret each coefficient. Overall satisfaction (Click to select) increases decreases remains same with an increase in satisfaction for each individual predictor except for friendliness of hosts.(c) Would the intercept seem to…A random sample of twelve students were chosen, and their midterm test score (y), as- signment score (x1), and missed classes (x2) were recorded as follows: Midterm Score, y Assignment Score, x1 Classes Missed, x2 85 74 76 90 85 87 94 98 81 91 76 74 65 50 55 65 55 70 65 70 55 70 50 55 5 7 5 2 6 3 2 5 4 3 1 4 (i) What is the fitted multiple linear regression equation of the form yˆ = b0 + b1x1 + b2x2? (ii) From part (i) above, estimate the midterm test score grade for a student who has an assignment score of 60 and missed 4 classes.
- The grades of a sample of 9 students on a prelim exam (x) and on the midterm exam (y) are shown in the excel worksheet. Find the regression equationA seafood-sales manager collected data on the maximum daily temperature, T, and the daily revenue from salmon sales, R, using sales receipts for 30 days selected at random. Using the data, the manager conducted a regression analysis and found the least-squares regression line to be Rˆ=126+2.37T. A hypothesis test was conducted to investigate whether there is a linear relationship between maximum daily temperature and the daily revenue from salmon sales. The standard error for the slope of the regression line is SEb1=0.65. Assuming the conditions for inference have been met, which of the following is closest to the value of the test statistic for the hypothesis test? t=0.274 A t=0.65 B t=1.54 C t=3.65 D t=193.85 EIn a laboratory experiment, data were gathered on the life span (y in months) of 33 rats, units of daily protein intake (x1), and whether or not agent x2 (a proposed life-extending agent) was added to the rats' diet (x2 = 0 if agent x2 was not added, and x2 = 1 if agent was added). From the results of the experiment, the following regression model was developed:ŷ = 36 + .8x1 − 1.7x2Also provided are SSR = 60 and SST = 180.The test statistic for testing the significance of the model is _____. a. 5.00 b. .50 c. .25 d. .33
- A sociologist was hired by a large city hospital to investigate the relationship between the number of unauthorized days that employees are absent per year and the distance (miles) between home and work for the employee. A sample of 10 employees was chosen, and the following data were collected. A. Is the estimated regression equation appropriate and adequateSuppose that a multiple linear regression model was fit to data and that the following output resulted: Coefficients: (Intercept)exam1exam2attendance Estimate20.001.3002.5000.685 Std. Error4.2910.2610.2745.608 t value-4.6604.9819.124 0.122 Pr(>|t|)<0.0001<0.0001<0.00010.9032 Perform a backwards selection process. Select the variable that would be removed first from the model. The significance level is 0.05 for testing purposes. attendance exam2 exam1Use the table of x and y values below to determine the slope of the least-squares regression line.