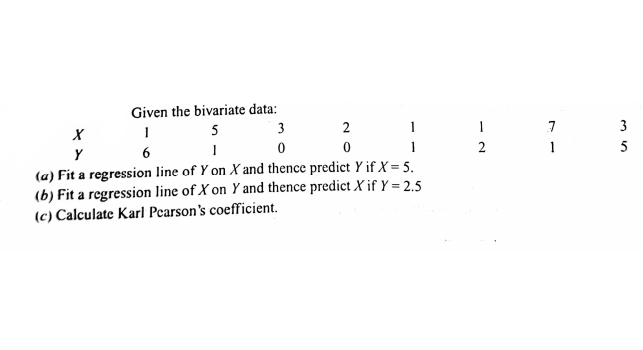
Given the bivariate data: 3 5 2 3 2 1 5 Y 6 (a) Fit a regression line of Y on X and thence predict Y if X = 5. (b) Fit a regression line of X on Y and thence predict X if Y = 2.5 (c) Calculate Karl Pearson's coefficient.


Q: Using Excel functions solve the following A company produces steel rods. The lengths of the steel r...
A:
Q: Analysts of traffic control systems believe that the average speed of heavy vehicles on highways has...
A: Given : Sample size (n) = 36 Sample mean (X¯) = 55 Standard deviation (S) = 5 The speed before the o...
Q: Use the scenario below to determine the correct values of n, p, q and x of the binomial distribution...
A:
Q: (a). Find the missing frequency from the following data: 30 40 Marks: Ho of Students The arithmetic ...
A:
Q: Consider the joint pdf f(u,v) and marginal pdfs fylu) and fy(v) for two continuous random variables ...
A:
Q: (i) If X has an arbitrary distribution function F,(x), find g(x) so that the random variable Y = g(X...
A:
Q: The probability of winning the "grand prize" at a fortune spinning wheel is p=0.2. Assume you record...
A:
Q: JIOWING box and whisker plot. Find the indicated values of the represented data. 15 41 46 73 99 10 2...
A: The box and whisker plot shows the five-number summary.
Q: For each of the following, indicate whether it is a positive linear, negative linear, or nonlinear r...
A: There is positive correlation if X increases then Y also increases. There is a negative correlation...
Q: 4. Let X~N(0, E²). Find the CRLB for variances of the unbiased estimator of T(0)= &. 5. Let X-f(x; 0...
A: Cramer-Rao inequality provides a lower bound to the variance of an unbiased estimator of T(θ).
Q: The annual rainfall in a certain region is modeled using the normal distribution shown below. The me...
A:
Q: Analyze the following scenarios and FORMULATE A SITUATION where TYPE I and TYPE II errors will be co...
A: Since the population characteristic(s) is being inferred through finite samples, it is highly expect...
Q: study shows that the fewer the number of wolves in a rural area (Y), the more farms there are in the...
A: From the given information we find the conclusion.
Q: Select two variables and Indicate the scale of measurement for each variable (nominal, ordinal, or s...
A: Note: Hi there! Thank you for posting the question. As you have posted multiple questions, as per th...
Q: A company manufactures tennis balls. When its tennis balls are dropped onto a concrete surface from ...
A: Given
Q: Graduate students drink more coffee than college students. Which type of hypothesis is this (hint: c...
A: Given that Graduate students drink more coffee than college students. We have to find which type of...
Q: What is the variance of the pointy-eared puppies distribution (n-4, p(pointy)=0.25, and p(floppy)=0....
A:
Q: Here are several scatterplots. The calculated correlations are 0.777, -0.021, 0.951, and - 0.923. Wh...
A:
Q: Find the P vlaue of the following example There are 150 paired values, (Xi,Yi), where Xi is a Bosto...
A:
Q: (a) Find the slope by using the formula (b) Find the y-intercept by using the formula a -y - br (c) ...
A: HERE USE GIVEN INFORMATION OF MEAN AND STANDARD DEVIATION OF LENGTH OF HAND AND FOOT
Q: If there are two events, X and Y, which may or may not be independent, with probabilities of 0.34 an...
A:
Q: As part of a research program for a new cholesterol drug, a pharmaceutical company would like to inv...
A: From the provided information, Sample size (n) = 7 Confidence level = 95%
Q: Five hundred children participated in a field demonstration. Their heights averaged 110cm with a sta...
A:
Q: The mean of a distribution is 15 and the standard deviation is 3. Use Chebyshev's Theorem and the fo...
A: Chebyshev's Theorem : For any data se the proportion of observation that lie within K standard devi...
Q: In the following problem, check that it is appropriate to use the normal approximation to the binomi...
A: Given n = 22 , p = 0.42 Find the following probabilities. (Round your answers to four decimal places...
Q: A psychologist claims that the mean age at which children start walking is 17 months. latif wanted t...
A: Givensample size(n)=20sample mean(x)=15standard deviation(s)=3α=0.05
Q: The average monthly mortgage (house) payment is $982 in a certain geographical area. If the payments...
A: As per our guidelines we can solve 15, 16 and 17 of question and rest can be reposted. Solution-: (a...
Q: identify the variable type (independent or dependent). For the independent variable, indicate whethe...
A: Given information: The information about some variables is given.
Q: The following table contains the probability distribution for the number of traffic accidents daily ...
A: Given data is No. of Accidents daily (x) P(X=xi) 0 0.29 1 0.32 2 0.15 3 0.11 4 0.07 ...
Q: What is the expected number of stiff-eared puppies (n=4, p(pointy)=D0.25, and p(floppy)=0.75)?
A: The Statspoodle, a German dog, can have pointy or floppy ears. Whether a Statspoodle has pointy or f...
Q: TABLE 6E.2 earing Diameter Data Sample Number i R Sample Number I R 1 34.5 3 13 35.4 8 2 34.2 4 14 3...
A: Given:
Q: The table summarizes results from 976 pedestrian deaths that were caused by automobile accidents. Pe...
A:
Q: The number ol hts to a website folows a Passon process Hts occur at the rate of 32 per minte between...
A:
Q: Exercise 2 An engineer analyses the presence (Yes-present, No- not present) of a specific terms in r...
A: @solution::::
Q: 4. Review the table and consider questions such as the following. Needs | Origin / Rating Рoor Satis...
A: Given: Origin Poor Needs improvement Satisfactory V Good Excellent Total External 0% 2% 12% 19%...
Q: A Mann-Whitney test is always a good idea for two population means test, if the populations are not ...
A: Solution-: A Mann-Whitney test is always a good idea for two population means test, if the populatio...
Q: Pick two variables from data below. identify the variable type (independent or dependent). For the i...
A: Given information: The information about some variables is given.
Q: Are X and Y independent? O No, p(x,y) # p(x)p(y) for x = 1, 3 and y O Yes, p(x,y) = p(x)p(y) for x =...
A: For the given joint distribution, Are X and Y independent?
Q: Use the graph below to determine a possible range for the correlation coefficient between the two va...
A:
Q: Explain the relationship between populations and sampling frames in social research.
A: Let SF denote sampling frames.
Q: Espanol Below are the times (in days) it takes for a sample of 19 customers from Sarah's computer st...
A:
Q: Example 17. The relation between a country’s import M and income y is given by 1 2 M = 10 + – · y wh...
A:
Q: The first proof of 200 pages of a book containing 560 pages revealed the following distribution of t...
A:
Q: Five hundred children participated in a field demonstration. Their heights averaged 110cm with a sta...
A:
Q: a) Find the best point estimate of the population proportion p. (Round to three decimal places as ne...
A: Note : AS PER POLICY I HAVE CALCULATED 3 SUBPARTS PLZ REPOST FOR REMAINING here given data n = 990 x...
Q: How would you describe your complete answer in APA
A: APA format is one of several different writing formats used for publications, papers, essays, and bo...
Q: Suppose we have a sample of 18 pairs of (x, y). Also suppose we have, 8z=9.76 Σ(τ-3 (y -)-1974.2 Sy=...
A:
Q: We conduct a study to assess if there is the same variation in grades between engineering students a...
A: Solution: Given information: n1= 15 Sample size of psychology studentsn2=15 Sample size of engineeri...
Q: c. What is the distribution of) x? > x - N( 210 , 8.5381) d. If one randomly selected runner is time...
A: As per guidelines expert have to answer first question three subparts only here three subparts are ...
Q: The following table shows the number of wins eight teams had during a football season. Also shown ar...
A: Given: x y 25.2 12 18.5 8 20.6 5 24.5 9 12.6 1 22.5 7 22.6 11 23.5 8


Trending now
This is a popular solution!

Step by step
Solved in 5 steps

- The following fictitious table shows kryptonite price, in dollar per gram, t years after 2006. t= Years since 2006 0 1 2 3 4 5 6 7 8 9 10 K= Price 56 51 50 55 58 52 45 43 44 48 51 Make a quartic model of these data. Round the regression parameters to two decimal places.Consider a linear regression model for the decrease in blood pressure (mmHg) over a four-week period with muy=2.8+0.8x and standard deviation chi=3.2. The explanatory variable x is the number of servings fruits and vegetables in a calorie-controlled diet. Using the 68-95-99.7 rule, between what two values would approximately 95% of the observed responses, y, fall when x = 7?Consider a simple linear regression model Y=α+βX+ε. We have collected 15 samples, from which we calculated the summary statistics ∑xi=66, ∑x2i=6568, ∑yi=459, ∑y2i=27933, ∑xiyi=11311. Suppose one of the data is supposed to be (x1=10, y1=30), but is incorrectly recorded as (x1=7, y1=34). All other observations are correctly recorded. What is the OLS estimators αˆ= ? and βˆ= ? based on the correct data.
- The birth lengths in cm (x) and birth weights in kg (y) of a sample of 50 newborn female babies are compared, yielding a correlation coefficient of r=0.578 and a linear regression equation of ŷ =−8.89+0.243x The babies all had lengths between 46.5 and 53.0 cm, and weights between 2.50 and 4.05 kg. Based on this, predict the birth weight of a newborn female baby with a birth length of 48.5 cm.The grades of a sample of 9 students on a prelim exam (x) and on the midterm exam (y) are shown below. Find the regression equation. y = 34.661 + 0.433x y = 0.777 + 12.0623x y = 12.0623 + 0.777x y = 34.661 - 0.433x7. in a regression model involving 44 observations, the following estimated regression equation was obtained. Y =29+18 X1 +43 X2 +87 X3 For this model SSR = 600 and SSE = 400 . The critical value of F for testing the significance of the above model at 5% level is A. 2.61 B. 0.67 C. 2.84 D. None E. 8.59
- Consider the following simple linear regression model: y = β0 + β1x + u. Using a sample of n observations on x and y, you estimate the model by OLS and obtain the estimates βˆ 0, βˆ 1, and the R-squared of the regression, R2 . Then you scale this sample by a factor of 100, obtain a new sample {xi/100; yi/100} for i = 1, . . . , n, re-estimate the model by OLS, and denote the new coefficient estimates by β˜ 0, β˜ 1, and the new R-squared of the regression by R˜2 . a) Give the expression of β˜ 1 in terms of βˆ 1, and justify your answer.The following estimated regression model was developed relating yearly income (y in $1000s) of 30 individuals with their age (x1) and their gender (x2) (0 if male and 1 if female).ŷ = 30 + 0.7x1 + 3x2Also provided are SST = 1200 and SSE = 384.The multiple coefficient of determination is _____.The prelim grades (x) and midterm grades (y) of a sample of 10 MMW students is modeled by the regression line y = 12.0623 + 0.7771x. Estimate the prelim grade if the midterm grade is 83.
- You conduct a regression of the squared residuals against the dummy variables X1, X2, and X3 and find that for the squared residuals regression: Multiple R 0.4145 R Square 0.1718 Adjusted R Square 0.1600 SEE 92.3760 Conduct a test at the level to see if conditional heteroskedasticity is present In view of your answer for a), what needs to be done?A regression equation is given by y = 11.37395 + 2.82773x. The following informantion about the variable x and y is also given. Calculate the value of xyA multiple linear regression model based on a sample of 13 weeks is developed to predict standby hours based on the total staff present and remote hours. The SSR is 23,638.17 and the SSE is 33,273.99. c. Compute the coefficient of multiple determination, r2, and interpret its meaning. (Round to four decimal places as needed.)