

Q: 3. Find arithmetic average from the following data. 20 X: f: 10 15 25 30 35 4 6. 8
A:
Q: A marketing manager conducts a study to determine whether there is a relationship between a person’s…
A: For the given data set Find the Computed F test-ratio.Find the value of r Round of your answer up to…
Q: X f per 0 14 9.33 2 23 15.33 4 37 24.67 6 36 24.00 8 22 14.67 10 18 12.00 What is the 25th…
A: Writing in ascending order: 0, 2, 4, 6, 8, 9.33, 10, 12.00, 14, 14.67, 15.33, 18, 22, 23, 24, 24.67,…
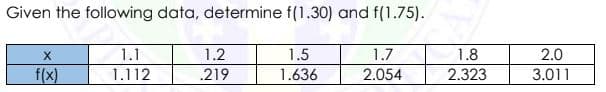
Q: Given the table of values below, find the average rate of change of the function f(x) on the…
A: The average rate of change over the interval [a, b] is given by ,…
Q: Given the tables for f(x) and g(x) below, find the following: f(x) | g(x) 2 4 1 7 2 3 4. 3 8 1 8 7 7…
A: We know, Average rate of change of f(x) from x=a to x=b is f(b)-f(a)b-a.
Q: b) Given the following data in table below: f(x) 9.367879 8.233241 7.180350 6.209329 -3.0 -2.8 -2.6…
A:
Q: Determine the average rate of change of the following function between the given values of the…
A: We can find the average rate of change as below
Q: Using the following data 20 = 0.3 21 = 0.43 22 = 0.56 23 = 0.69 24 = 0.82 25 = 0.95 f(x) 2.3185…
A: note : As per our company guidelines we are supposed to answer ?️only first 3 sub-parts. Kindly…
Q: Determine the average rate of change of the following function between the given values of the…
A: We can find the average rate of change as below
Q: Make the analysis with the Likert scale of the following data
A: Given information: The data represents the ratings given by 6 groups of Encuestado.
Q: For the following data, find Vy, Here y, = f(x,) and x, = x, + ih, i= 0,1,2,3. 1 3 6. 26 f (x) 5 10…
A:
Q: For the following data: 4205, 4200, 3800, 3500, 3478, 2800, 2800, 2310 Find coefficient of…
A:
Q: Find the value of F-test according to the following information (number of observation=30) Model 1:…
A:
Q: For the following data, find V²y, . Here y, = f(x,) and x, = x, +ih, i =0,1, 2,3... 13 5 7 12 20 25…
A:
Q: Given the tables for f & g below, find the following: f(x) g(x) 3 8 8 9 4 7 8. 9. 1 1 Average rate…
A: Here from the table 1) first calculate the value of the function g(x) at x=0 and at x=1…
Q: Given the following table, give the best estimate for f'(3) 6. 12 15 f(x) 30 41 51 60 28 The…
A: Function values are given in the table, we have to find the estimate for f'(3)
Q: For the function f(x) given in the table, find the average rate of change over each specified…
A:
Q: The percentage of damage is thought to be a function of speed. In 15 different vehicles,…
A: Note: In case of multiple subparts, answer to first three subparts will be provided as per the…
Q: Use the function f (x) = 2* to answer the following question. Over which interval is the average…
A:
Q: explain the concept of linear interpolation, Using linear interpolation find f(3) for f(x)=5^x.…
A: We need to find the linear interpolation of f(3). f(x)= 5^x
Q: Find f(3.1) based on the following data points (2.2, 25.234) ; (2.9, 11.146); (3.3, -1.647); ( 3.8,…
A: Find your answer below
Q: Consider the following data relating hours spent studying (X) and average grade on course quizzes…
A:
Q: 26 Use the following table to estimate /f(x) dx 10 10 14 18 22 26 x100 88 72 50 28
A: The value of f(x) are space 4 units apart,So that, ∆x = 4 and n=(b-a)/∆x =(26-10)/4=4.
Q: Given the tables for f(x) and g(x) below, find the following: f(x) g(x) 2 1 4 2 9. 3 6. 4. 8 7 6. 6.…
A:
Q: Using the following data 20 = 0.3 0.43 x2 = 0.56 23 = 0.69 24 = 0.82 25 0.95 f(x) 2.3185 2.4159…
A: Note: Since we only answer up to 3 sub-parts, we'll answer the first 3. Please resubmit the question…
Q: Consider the following data relating hours spent studying (X) and average grade on course quizzes…
A: In this case, X represent the hours spent is studying and Y represents the average grade on course…
Q: Calculate mode from the following data: Marks No. of students Marks No. of students Above 0 80 Avove…
A: We first make the table interval form Since above 0 there are 80 students and above 10 there are 77…
Q: Plot the following data using proper graphing techniques. (Hint: P depends on T) Temperature…
A: as per guidelines, we can only do a maximum 3 part of the question if you want all please ask them…
Q: Given the following table, give the best estimate for f'(3) 6 9. 12 15 f(x) 38 43 55 60 22 3
A: Since you have asked multiple question, we will solve the first question for you as per our guide…
Q: Given the tables for f(x) and g(x) below, find the following: f(x) g(x) 1 4 6. 8 3 3 2 8 5 7 1 8 7 1…
A: The average rate of change of function g over the interval a≤x≤b is given by:average rate =…
Q: Complete the following statements: 1. In general,________ % of the values in a data set lie at or…
A:
Q: For the following data, N = _____. X f 4 2 3 3 2 1 1…
A: Given, N=?
Q: For the following data what is the upper control limit? index n np р 1 15 0.05 2 18 0.05 3 12 0.04 4…
A: The formula to calculate the upper control limit for proportion of defectives is defined by…
Q: In solving for the 45th percentile , the lower limit to be used is score f cf cf percentage 40-44 18…
A: Given: The provided data is: Score Class boundary f cf cf percentage 40-44 44.5-39.5 6 18 100…
Q: Using the data given in the following table 4. 3.5 3 2.5 176 122.5 81 28 f(x) If the approximated…
A:
Q: In each of the following variables, decide which type of data grouping (single-value, limit, or…
A: Quantitative variable: A variable that provides numerical values of individual and Arithmetic…
Q: Consider the functionf(x) whose graph is given below. 15 f(エ) 10 5 10 15 20 25 30 30 (a) Find…
A:
Q: 69. From the following data calculate the missing value when mean is 415.86: 430 410 412 413 417 (X)…
A:
Q: Suppose f(x) = 1/20 from 5 to 25. What is the 25th percentile of X? %3D 10 1/20 None of the other…
A: F(x) = 1/20 from 5 to 25
Q: Given the tables for f & g below, find the following: f(x) g(x) 4 6. 3 4 9. 0. 8 8 1 3 6. 4 1…
A: Average rate of change of any function f(x) from 'a' to 'b' is, (f(b) - f(a))/(b-a)
Q: -From the following data find the marks in English. If the marks in Hindi is 50. Hindi (X) English…
A: It is given that For X, mean = 40, SD = 10 For Y, mean = 50, SD = 16 Correlation coefficient = 0.5
Q: For the following questions, use either the statistics functions on your calculator or another…
A: It is widely used in statistics . It is an application of the measures of dispersion .
Q: Determine the net change and the average rate of change given f(x) = 2x2+5x between x=1…
A: Given f(x) = 2x2+5x between x=1 and x=4.
Q: If the average value of f(x) on an interval is a number c, what will be the average value of the…
A: Given that the average value of f(x) on an interval = c We have to find whatwill be the average…
Q: What formula is used to compute the test value of F-test? Select the correct response: MSW f: MSB…
A: Given : Here we have to identified the formula for test statistic
Q: Establish the relationship between x & y approximately by using an interpolation formula from the…
A:


Step by step
Solved in 3 steps


- For the following exercises, consider the data in Table 5, which shows the percent of unemployed in a city ofpeople25 years or older who are college graduates is given below, by year. 41. Based on the set of data given in Table 7, calculatethe regression line using a calculator or othertechnology tool, and determine the correlationcoefficient to three decimal places.Let X - T(28). Find P40(x) (50th percentile of X)Consider the following data relating hours spent studying (X) and average grade on course quizzes (Y): X Y 5 6 3 8 4 8 7 10 5 7 6 9 From these observations, can we conclude that hours spent studying caused increases in quiz grades?
- In a study relating sleep and death rate ,the following data were obtained.Use the function y = ax2 + bx + c to model the data.Consider the following data relating hours spent studying (X) and average grade on course quizzes (Y): X Y 5 6 3 8 4 8 7 10 5 7 6 9 From these observations, can we conclude that hours spent studying caused increases in quiz grades? Yes NoConsider the following data relating hours spent studying (X) and average grade on course quizzes (Y): X Y 5 6 3 8 4 8 7 10 5 7 6 9 compute ΣX
- The following data lists eight different investment amounts (X) and the amount of interest they earned (Y):What's the measure of g?The following data represent the living situation of newlyweds in a large metropolitan area and their annual household income. Find the marginal frequency for newlyweds who own their own home.
- If you are only comparing two groups of respondents, and the t-value is found to be 2.30, what will the F statistic be?Consider the following data relating hours spent studying (X) and average grade on course quizzes (Y): X Y 5 6 3 8 4 8 7 10 5 7 6 9 Compute: ∑X∑Y/ nIt is evaluated that there is a relationship between working experience in the business (X) and the number of daily errors (Y). Data are given below. Which of the following is the value of the coefficient of determination?