GIVEN THE FOLLOWING DATA OF SCORES OF STUDENTS IN AN EXAM IN BASIC STATISTICS 29 32 41 24 42 34 23 32 40 29 30 42 29 35 27 45 36 44 28 35 35 26 24 28 32 25 27 26 28 26
GIVEN THE FOLLOWING DATA OF SCORES OF STUDENTS IN AN EXAM IN BASIC STATISTICS 29 32 41 24 42 34 23 32 40 29 30 42 29 35 27 45 36 44 28 35 35 26 24 28 32 25 27 26 28 26

Glencoe Algebra 1, Student Edition, 9780079039897, 0079039898, 2018
18th Edition
ISBN:9780079039897
Author:Carter
Publisher:Carter
Chapter10: Statistics
Section10.1: Measures Of Center
Problem 9PPS

Related questions
Question
Answer #2 only
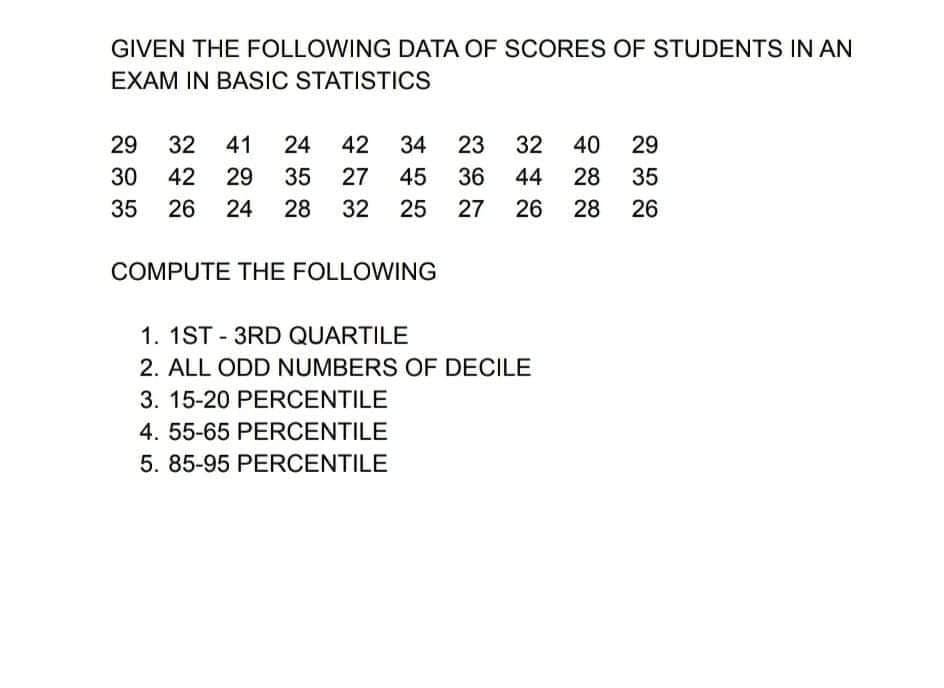
Transcribed Image Text:GIVEN THE FOLLOWING DATA OF SCORES OF STUDENTS IN AN
EXAM IN BASIC STATISTICS
29
32
41
24
42
34
23
32
40
29
30
42
29
35
27
45
36
44
28
35
35
26
24
28
32
25
27
26
28
26
COMPUTE THE FOLLOWING
1. 1ST - 3RD QUARTILE
2. ALL ODD NUMBERS OF DECILE
3. 15-20 PERCENTILE
4. 55-65 PERCENTILE
5. 85-95 PERCENTILE
Expert Solution
This question has been solved!
Explore an expertly crafted, step-by-step solution for a thorough understanding of key concepts.

Step by step
Solved in 2 steps

Recommended textbooks for you
Glencoe Algebra 1, Student Edition, 9780079039897…
Algebra
ISBN:
9780079039897
Author:
Carter
Publisher:
McGraw Hill
Glencoe Algebra 1, Student Edition, 9780079039897…
Algebra
ISBN:
9780079039897
Author:
Carter
Publisher:
McGraw Hill