1. Given the following scores in a Psychology test , make a frequency table. Raw scores 47 56 42 28 56 55 82 78 50 55 41 56 57 38 62 52 66 65 72 37 47 42 52 47 54 48 52 47 44 39 53 48 42 54 62 68 48 56 42 60 Class limits Class f RF% CF boundaries
1. Given the following scores in a Psychology test , make a frequency table. Raw scores 47 56 42 28 56 55 82 78 50 55 41 56 57 38 62 52 66 65 72 37 47 42 52 47 54 48 52 47 44 39 53 48 42 54 62 68 48 56 42 60 Class limits Class f RF% CF boundaries

Glencoe Algebra 1, Student Edition, 9780079039897, 0079039898, 2018
18th Edition
ISBN:9780079039897
Author:Carter
Publisher:Carter
Chapter10: Statistics
Section10.6: Summarizing Categorical Data
Problem 4DGP

Related questions
Question
100%
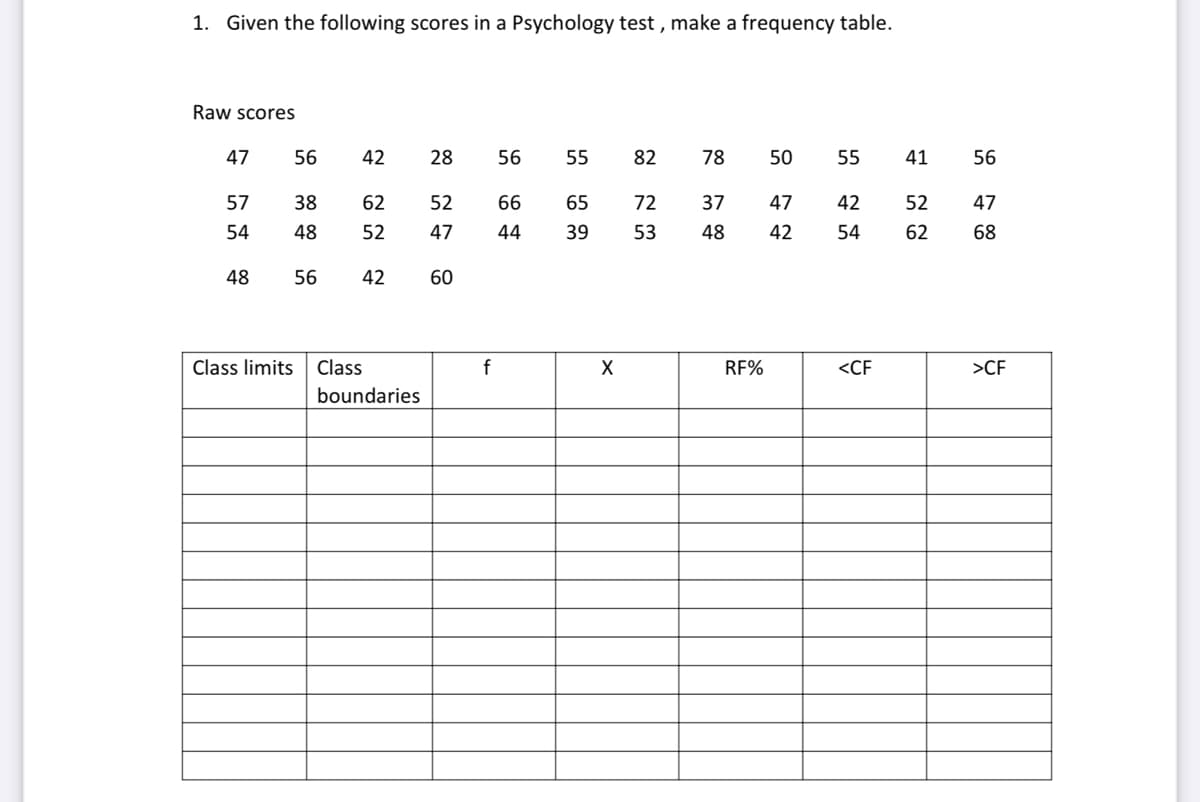
Transcribed Image Text:1. Given the following scores in a Psychology test , make a frequency table.
Raw scores
47
56
42
28
56
55
82
78
50
55
41
56
57
38
62
52
66
65
72
37
47
42
52
47
54
48
52
47
44
39
53
48
42
54
62
68
48
56
42
60
Class limits
Class
f
RF%
<CF
>CF
boundaries
Expert Solution
This question has been solved!
Explore an expertly crafted, step-by-step solution for a thorough understanding of key concepts.

This is a popular solution!

Trending now
This is a popular solution!

Step by step
Solved in 2 steps with 1 images

Recommended textbooks for you
Glencoe Algebra 1, Student Edition, 9780079039897…
Algebra
ISBN:
9780079039897
Author:
Carter
Publisher:
McGraw Hill
Glencoe Algebra 1, Student Edition, 9780079039897…
Algebra
ISBN:
9780079039897
Author:
Carter
Publisher:
McGraw Hill