Given the following data, use least-squares regression to develop a relation between the number of rainy summer days and the number of games lost by the Boca Raton Cardinal baseball team D Year Rainy Days Games Lost 1 11 24 2 20 19 where y number of games lost and x number of rainy summer days 3 6 6 4 8 19 5 26 18 6 15 14 7 16 16 8 14 13 9 10 7 22 1 15 The least squares regression equation that shows the best relationship between the number of rainy summer days and the number of games lost is (enter your response for the y-axis intercept rounded to two decimal places and for the slope rounded to three decimal places)
Q: Julia Robertson is a senior at Tech, and she’s investigating different ways to finance her final…
A: Objective Functions and Constraints: Based on the given details, the objective…
Q: Sales of tablet computers at Ted Glickman's electronics store in Washington, D.C., over the past 10…
A: Given, Week Demand 1 20 2 23 3 27 4 37 5 26 6 30 7 35 8 22 9 24 10 29…
Q: 1. Each day, Joey's pub makes 3 types of club sandwiches: the Lil' Pickle, the Mama Mayo, and the…
A: A linear programming problem formulation has 3 parts: Decision variables, Objective function, and…
Q: The Wisteria University athletic department is considering a campaign next year to raise funds for a…
A: Find the given details below: Given details: The prior probability of winning season (G) 0.6…
Q: Select the best answer for the question. 12. Customers like to choose the color of their cars.…
A: In designing process structure in manufacturing, three parameters are considered. These parameters…
Q: Using simplex method.
A: The Decision Variables are: Let, x1 represent the number of acres of crop A x2 the number of acres…
Q: b) A grocery receives its weekly supply of eggs every Thursday morning. This shipment must last…
A:
Q: Imagine you have to select and present your team, you have to create a report that includes the team…
A: This project intends to expand on the debate for Module 3 on the building of sustainable monitoring…
Q: Type the linear program, optimal solution, and objective function value in a word document. Submit…
A:
Q: The manager of travel agency has been using a seasonally adjusted forecast to predict demand for…
A: MAD is the proportion between absolute errors and the number of periods. MAPE is the average value…
Q: If a strategy hasn't been attempted, it isn't a good one. Give examples of the many testing…
A: Strategy is simply an idea of a person whose successful implementation can result in some benefits.…
Q: Toys from the world, for the world 5 years ago, while conducting an online search for a toy for her…
A: Transport Packaging refers to materials used in addition to Primary Packaging to accommodate the…
Q: Write a short essay that explains how the balanced scorecard is different to the traditional ways of…
A: Balanced scorecard can be broadly defined as a performance management and strategic tool that is…
Q: D.) Calculate the regression line. Compute the MAD and MSE for the regression line. E.) Use your…
A: The values of the MAD and MSE were having some errors. Below the correct MAD and MSE of all the…
Q: Select the best answer for the question. 4. A supply chain consulting firm offers by its nature OA.…
A: Supply chain consulting firms offer advice to businesses on how to improve their supply chains. They…
Q: Given the following nodes from A to G as shown in the diagram, determine the shortest path network…
A: Project management is a vast field where many different applications are implemented to deliver the…
Q: What is a political action committee (PAC), a lobbyist, and what is dark money? How do these…
A: Political action committee A political action committee (PAC) is a type of 527 organization allowed…
Q: 3. The company is working with a supplier to develop a new engineering product. How can the supplier…
A: The service system design matrix categorizes the services based on the customer/server contact. 1.…
Q: project scheduling, the critical route approach is crucial, but what does it really do?
A: Critical path is the longest path on a project network diagram. In critical route approach, the…
Q: Ethics are crucial in project management
A: Honesty, accountability, respect, and fairness are characteristics that are essential to the project…
Q: Café Michigan's manager, Gary Stark, suspects that demand for mocha latte coffees depends on the…
A: Given, Price Number Sold 2.7 770 3.6 550 1.9 975 4.2 245 3.2 315 4.05 480 y =…
Q: 2. ( A large business process outsourcing company operates 5 days a week (Monday to Friday). The…
A: X1 = Number of employees who start their work on Monday on-site X2 = Number of employees who start…
Q: QUESTION 20 Currently, the average time between failures of a part is 100 hours and the average…
A: Solution
Q: Type the linear program, optimal solution, and objective function value in a word document. Submit…
A:
Q: Simply and simply describe the idea of project scope and the impact it has on the three project…
A: The project scope is a broad definition of a project's depth, complexity and output. The linear…
Q: Mark Gershon, owner of a musical instrument distributorship, thinks that demand for guitars may be…
A: By reducing the total of the offsets or residuals of points from the plotted curve, the least…
Q: List two benefits of outsourcing to a company during the development of an IT/IS project. Define…
A: By contracting with an outside party to do an otherwise in-house task or provide an entirely new…
Q: A dry cleaner uses exponential smoothing to forecast equipment usage at its main plant. August usage…
A: Formula = Forecast for previous period+Smoothing constant(Actal usage- Forecast for previous period)…
Q: A political candidate is planning his media budget for an upcoming election. He has $90,500 to…
A: Let, S = Number of small road signs to be placed L = Number of large road signs to be placed B =…
Q: What are dimensions of a product quality?
A: Note - Hi! Thank you for the question As per the honour code, We’ll answer the first question since…
Q: Identify the two ways for reducing product costs to a predetermined level. Which is more widespread…
A: Two ways for reducing product cost: Obviously, the objective of costing approaches is to eliminate…
Q: B. Tradeoffs with Quality Costs. Consider the following problem. Banga, Inc. is a startup company…
A: Control costs Failure Costs Current quality costs 160,000 1,440,000…
Q: Could anyone answer this problem? We have four products: Scones ($1 revenue) Bagels ($2 revenue)…
A: Decision Variables: Suppose-S be the no. of scones to be producedB be the no. bagels to be…
Q: Suppose there is a company that does all the work manually and has a particular system in each…
A: Enterprise resource planning is a business suite that enables various organizations to manage the…
Q: What effect do processes like expert judgment, data analysis, and meetings have on the ultimate…
A: Definitions: Expert judgment: - Expert judgment refers to the opinion or suggestion of a person who…
Q: What is the objective function?
A: Linear programming is a mathematical technique that is also used in operations management…
Q: Introduction (briefly discuss about SCM) Discuss the main functions of supply chain management (SCM)…
A: Production is the process of transforming the raw materials into the finished goods for the…
Q: A.) Compute the 3-period simple moving average forecasts. Compute the MAD and MSE for the 4-period…
A: As per Bartleby guidelines, we can only solve the first three subparts of one question at a…
Q: Calculate the ES, EF, LS, and LF times and the slack for each activity in the figure below, and…
A: A network diagram related to the project shows the sequence of the task that is performed to…
Q: If the first activity in a given project is D which precedes A, B. And activity A precedes H,G. And…
A: free float = EF of same activity - ES of next activity-1
Q: The following information pertains to Material 001 used by XYZ Company Annual usage in units…
A: Reorder point is used for company for holding extra stock for for future emergence. It is calculate…
Q: calculate x-bar for the data shown, to two decimal places, 9,7.9,10,21.8,7
A: Control charts are also known as process-behaviour charts. It is a statistical process that helps in…
Q: 1. Concisely describe the term Operation Management.
A: As per Bartleby guidelines, we can only solve one question at a time...Kindly upload the other…
Q: Ana owns a consulting business that helps software companies market their services to school…
A: Given: fixed cost 7000 SP 4635.7 variable cost 1676.6
Q: A local distributor for a national tire company expects to sell approximately 200 steel-belted…
A: Given data Annual demand (D)= 200 units Annual carrying cost (H)= $20 per tire Ordering cost (S)…
Q: Find solution using simplex method. Maximize z = 4x₁ + 3x₂ Subject to the constraints 2x₁ + x₂ ≤…
A: Linear Programming is a mathematical and statistical technique used in operations that help…
Q: Calculate ROI if profit margin is 12% and Asset turn over ratio is 1.4? Q): calculate ReOrder Point…
A: Given: Profit margin= 12% Asset turnover ratio = 1.4
Q: Maximize eamings = $0.80xX₁ + $0.40X₂ + $1.20X3 - $0.10X4 subject to X₁ + 2X₂ + X3 +5X = 150 X₂ 4X₂…
A: Linear programming is a mathematical technique that is also used in operations management…
Q: A. A newspaper is bought for Rs. 5 from a shopkeeper and sold at Rs. 10. Any unsold newspaper for…
A: Find the Given details below: Given Details: Mean (Average Demand) 50 Newspapers Standard…
Q: 6.4: An order for 50 of a product is processed on work centers A and B. The setup time on A is 45…
A: Manufacturing lead time is the time for processing, preparing materials, manufacturing, and…
please solve within 30 minutes.
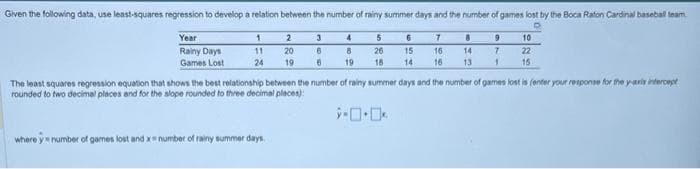
Step by step
Solved in 3 steps with 1 images
- The owner of a restaurant in Bloomington, Indiana, has recorded sales data for the past 19 years. He has also recorded data on potentially relevant variables. The data are listed in the file P13_17.xlsx. a. Estimate a simple regression equation involving annual sales (the dependent variable) and the size of the population residing within 10 miles of the restaurant (the explanatory variable). Interpret R-square for this regression. b. Add another explanatory variableannual advertising expendituresto the regression equation in part a. Estimate and interpret this expanded equation. How does the R-square value for this multiple regression equation compare to that of the simple regression equation estimated in part a? Explain any difference between the two R-square values. How can you use the adjusted R-squares for a comparison of the two equations? c. Add one more explanatory variable to the multiple regression equation estimated in part b. In particular, estimate and interpret the coefficients of a multiple regression equation that includes the previous years advertising expenditure. How does the inclusion of this third explanatory variable affect the R-square, compared to the corresponding values for the equation of part b? Explain any changes in this value. What does the adjusted R-square for the new equation tell you?Suppose that a regional express delivery service company wants to estimate the cost of shipping a package (Y) as a function of cargo type, where cargo type includes the following possibilities: fragile, semifragile, and durable. Costs for 15 randomly chosen packages of approximately the same weight and same distance shipped, but of different cargo types, are provided in the file P13_16.xlsx. a. Estimate a regression equation using the given sample data, and interpret the estimated regression coefficients. b. According to the estimated regression equation, which cargo type is the most costly to ship? Which cargo type is the least costly to ship? c. How well does the estimated equation fit the given sample data? How might the fit be improved? d. Given the estimated regression equation, predict the cost of shipping a package with semifragile cargo.A small computer chip manufacturer wants to forecast monthly ozperating costs as a function of the number of units produced during a month. The company has collected the 16 months of data in the file P13_34.xlsx. a. Determine an equation that can be used to predict monthly production costs from units produced. Are there any outliers? b. How could the regression line obtained in part a be used to determine whether the company was efficient or inefficient during any particular month?
- The management of a technology company is trying to determine the variable that best explains the variation of employee salaries using a sample of 52 full-time employees; see the file P13_08.xlsx. Estimate simple linear regression equations to identify which of the following has the strongest linear relationship with annual salary: the employees gender, age, number of years of relevant work experience prior to employment at the company, number of years of employment at the company, or number of years of post secondary education. Provide support for your conclusion.The Baker Company wants to develop a budget to predict how overhead costs vary with activity levels. Management is trying to decide whether direct labor hours (DLH) or units produced is the better measure of activity for the firm. Monthly data for the preceding 24 months appear in the file P13_40.xlsx. Use regression analysis to determine which measure, DLH or Units (or both), should be used for the budget. How would the regression equation be used to obtain the budget for the firms overhead costs?An antique collector believes that the price received for a particular item increases with its age and with the number of bidders. The file P13_14.xlsx contains data on these three variables for 32 recently auctioned comparable items. Estimate a multiple regression equation using the given data. Interpret each of the estimated regression coefficients. Is the antique collector correct in believing that the price received for the item increases with its age and with the number of bidders? Interpret the standard error of estimate and the R-square value for these data.
- A trucking company wants to predict the yearly maintenance expense (Y) for a truck using the number of miles driven during the year (X1) and the age of the truck (X2, in years) at the beginning of the year. The company has gathered the data given in the file P13_13.xlsx. Note that each observation corresponds to a particular truck. Estimate a multiple regression equation using the given data. Interpret each of the estimated regression coefficients. Also, interpret the standard error of estimate and the R-square value for these data.Do the sales prices of houses in a given community vary systematically with their sizes (as measured in square feet)? Answer this question by estimating a simple regression equation where the sales price of the house is the dependent variable, and the size of the house is the explanatory variable. Use the sample data given in P13_06.xlsx. Interpret your estimated equation, the associated R-square value, and the associated standard error of estimate.Management of a home appliance store would like to understand the growth pattern of the monthly sales of Blu-ray disc players over the past two years. Managers have recorded the relevant data in the file P13_33.xlsx. a. Create a scatterplot for these data. Comment on the observed behavior of monthly sales at this store over time. b. Estimate an appropriate regression equation to explain the variation of monthly sales over the given time period. Interpret the estimated regression coefficients. c. Analyze the estimated equations residuals. Do they suggest that the regression equation is adequate? If not, return to part b and revise your equation. Continue to revise the equation until the results are satisfactory.
- The file P13_28.xlsx contains monthly retail sales of U.S. liquor stores. a. Is seasonality present in these data? If so, characterize the seasonality pattern. b. Use Winters method to forecast this series with smoothing constants = = 0.1 and = 0.3. Does the forecast series seem to track the seasonal pattern well? What are your forecasts for the next 12 months?The file P13_02.xlsx contains five years of monthly data on sales (number of units sold) for a particular company. The company suspects that except for random noise, its sales are growing by a constant percentage each month and will continue to do so for at least the near future. a. Explain briefly whether the plot of the series visually supports the companys suspicion. b. By what percentage are sales increasing each month? c. What is the MAPE for the forecast model in part b? In words, what does it measure? Considering its magnitude, does the model seem to be doing a good job? d. In words, how does the model make forecasts for future months? Specifically, given the forecast value for the last month in the data set, what simple arithmetic could you use to obtain forecasts for the next few months?The file P14_01.xlsx contains data on 100 consumers who drink beer. Some of them prefer light beer, and others prefer regular beer. A major beer producer believes that the following variables might be useful in discriminating between these two groups: gender, marital status, annual income level, and age. a. Use logistic regression to classify the consumers on the basis of these explanatory variables. How successful is it? Which variables appear to be most important in the classification? b. Consider a new customer: Male, Married, Income 42,000, Age 47. Use the logistic regression equation to estimate the probability that this customer prefers Regular. How would you classify this person?