Histogram of US_county_data$median_age_2017 30 40 50 60 70 20 US county_data$median_age_2017 Relative Frequency 0.1 0.2 0.3 0.4 0.5 0'0
Histogram of US_county_data$median_age_2017 30 40 50 60 70 20 US county_data$median_age_2017 Relative Frequency 0.1 0.2 0.3 0.4 0.5 0'0

Holt Mcdougal Larson Pre-algebra: Student Edition 2012
1st Edition
ISBN:9780547587776
Author:HOLT MCDOUGAL
Publisher:HOLT MCDOUGAL
Chapter11: Data Analysis And Probability
Section11.1: Stem-and-leaf Plots And Histograms
Problem 2E

Related questions
Question
Determine the proportion of the area of the relative frequency histogram that is shaded.
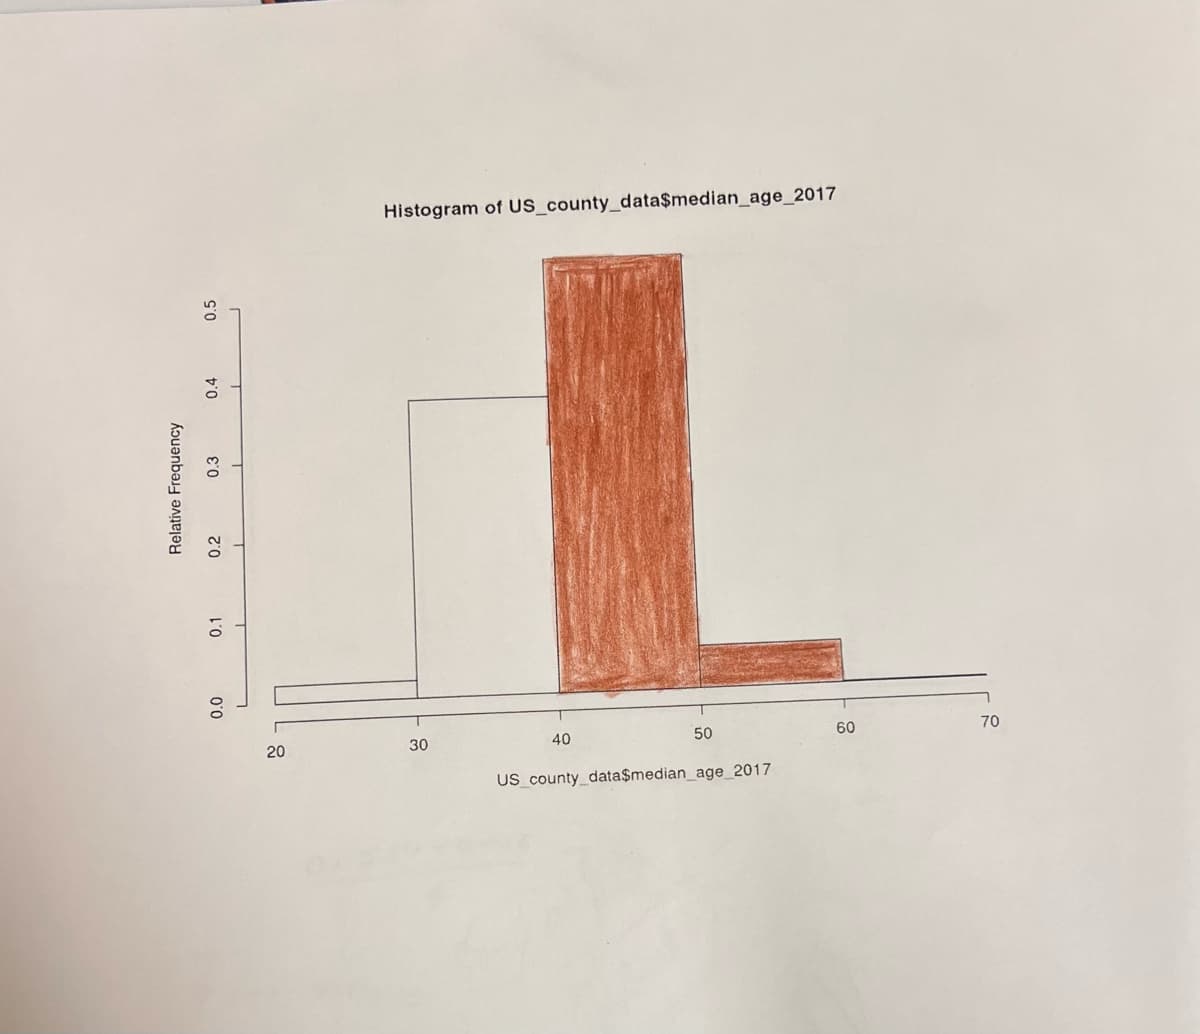
Transcribed Image Text:Histogram of US_county_data$median_age_2017
40
50
60
70
20
30
US county_data$median_age_2017
Relative Frequency
0.1
0.2
0.3
0.4
0.5
Expert Solution
Step 1
The relative frequency for a given distribution is assumed as the likelihood of occurring (i.e., how often the specific variable is repeated in the frequency table) of the respective variable from the frequency distribution.

Step by step
Solved in 2 steps

Recommended textbooks for you
Holt Mcdougal Larson Pre-algebra: Student Edition…
Algebra
ISBN:
9780547587776
Author:
HOLT MCDOUGAL
Publisher:
HOLT MCDOUGAL

Glencoe Algebra 1, Student Edition, 9780079039897…
Algebra
ISBN:
9780079039897
Author:
Carter
Publisher:
McGraw Hill
Holt Mcdougal Larson Pre-algebra: Student Edition…
Algebra
ISBN:
9780547587776
Author:
HOLT MCDOUGAL
Publisher:
HOLT MCDOUGAL
Glencoe Algebra 1, Student Edition, 9780079039897…
Algebra
ISBN:
9780079039897
Author:
Carter
Publisher:
McGraw Hill