Given the following table. Calculate the mean number of children per family for the sample. "| Number of children | Number of families 8 16 22 2 3 14 6 5 4 O 1.91 O 2.47 O 3.14 O 2.19
Given the following table. Calculate the mean number of children per family for the sample. "| Number of children | Number of families 8 16 22 2 3 14 6 5 4 O 1.91 O 2.47 O 3.14 O 2.19

Glencoe Algebra 1, Student Edition, 9780079039897, 0079039898, 2018
18th Edition
ISBN:9780079039897
Author:Carter
Publisher:Carter
Chapter4: Equations Of Linear Functions
Section: Chapter Questions
Problem 8SGR

Related questions
Question
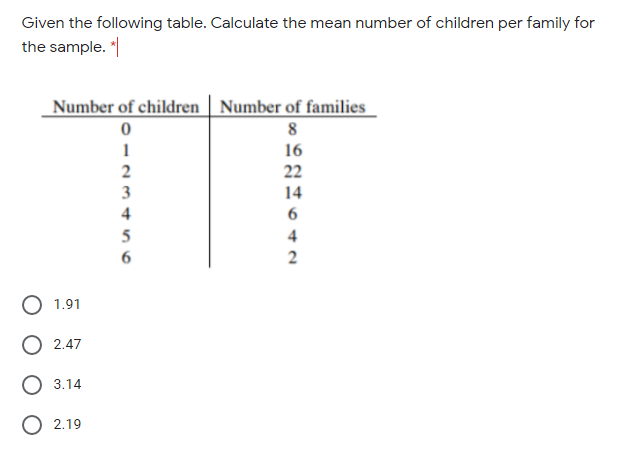
Transcribed Image Text:Given the following table. Calculate the mean number of children per family for
the sample. "|
Number of children Number of families
8
16
2
22
3
14
4
4
1.91
O 2.47
O 3.14
O 2.19
Expert Solution
This question has been solved!
Explore an expertly crafted, step-by-step solution for a thorough understanding of key concepts.

Step by step
Solved in 2 steps

Recommended textbooks for you
Glencoe Algebra 1, Student Edition, 9780079039897…
Algebra
ISBN:
9780079039897
Author:
Carter
Publisher:
McGraw Hill
Glencoe Algebra 1, Student Edition, 9780079039897…
Algebra
ISBN:
9780079039897
Author:
Carter
Publisher:
McGraw Hill