Given the fuel economy data shown in the frequency Distribution at the right, what are the approximate Mean, variance and standard deviation of the populationi 58 60 62 64 66 68 7O 72 74 Height (in inches) Illustrated? Fuel Economy The city mileage (in miles per gallon) for 24 family sedans Mileage (in miles per gallon) Frequency 22-27 16 28-33 34-39 40-45 3 46-51
Given the fuel economy data shown in the frequency Distribution at the right, what are the approximate Mean, variance and standard deviation of the populationi 58 60 62 64 66 68 7O 72 74 Height (in inches) Illustrated? Fuel Economy The city mileage (in miles per gallon) for 24 family sedans Mileage (in miles per gallon) Frequency 22-27 16 28-33 34-39 40-45 3 46-51

Glencoe Algebra 1, Student Edition, 9780079039897, 0079039898, 2018
18th Edition
ISBN:9780079039897
Author:Carter
Publisher:Carter
Chapter10: Statistics
Section10.3: Measures Of Spread
Problem 26PFA

Related questions
Question
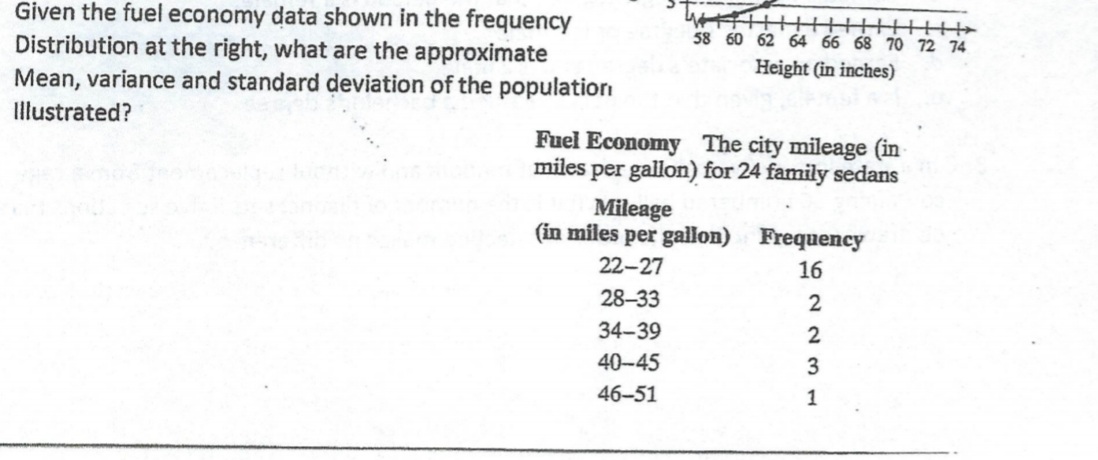
Transcribed Image Text:Given the fuel economy data shown in the frequency
Distribution at the right, what are the approximate
Mean, variance and standard deviation of the populationi
58 60 62 64 66 68 7O 72 74
Height (in inches)
Illustrated?
Fuel Economy The city mileage (in
miles per gallon) for 24 family sedans
Mileage
(in miles per gallon) Frequency
22-27
16
28-33
34-39
40-45
3
46-51
Expert Solution
This question has been solved!
Explore an expertly crafted, step-by-step solution for a thorough understanding of key concepts.

This is a popular solution!

Trending now
This is a popular solution!

Step by step
Solved in 3 steps with 2 images

Recommended textbooks for you
Glencoe Algebra 1, Student Edition, 9780079039897…
Algebra
ISBN:
9780079039897
Author:
Carter
Publisher:
McGraw Hill
Glencoe Algebra 1, Student Edition, 9780079039897…
Algebra
ISBN:
9780079039897
Author:
Carter
Publisher:
McGraw Hill