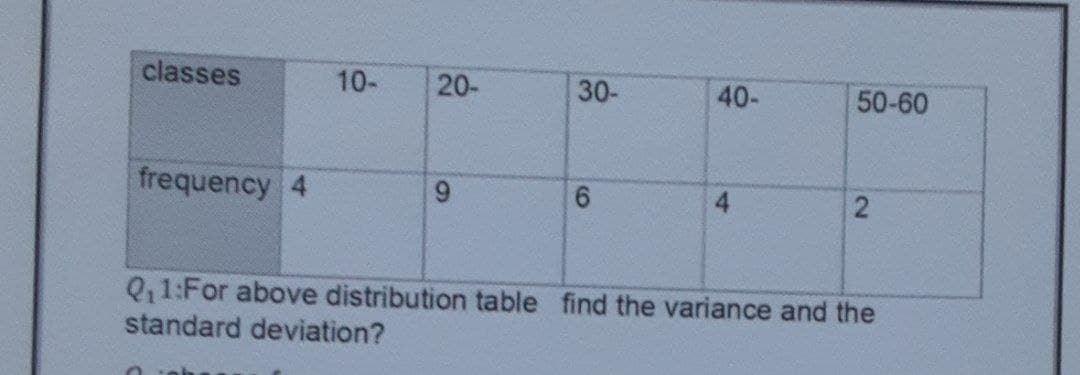
classes 10- 20- 30- 40- 50-60 frequency 4 Q11:For above distribution table find the variance and the standard deviation? 21 4,


Q: If the population mean and variance are 154 and 36 respectively, then the sample size that makes a…
A: Population mean = 154Variance = 36Standard error of the sample mean = 0.50
Q: Q2 – For the data in table (1). - 1- Draw the frequency distribution diagram. 2 - Find the class…
A:
Q: The following data provided are the average hours fifty-six grade 8 students spent doing their…
A: Given: The lowest amount of hours recorded is 5 hours (every 5 school days), and the highest is 34…
Q: The sample variance, ² = Σ(x-x)² n-1 {14, 13, 16, 9, 3, 7, 11, 12, 11, 4} is I of the data
A:
Q: 19. Pupils Per Teacher The following frequency distribu 23. F tion shows the average number of…
A: Given:
Q: Give a data values :8,5,2,5,3,11,7,2,8,8,3 then A. Construct frequency distribution table calculat…
A: we are suppose to answer three sub parts .
Q: -Study and analyze ne number of shoes sold per day at a retail store is shown in the table below.…
A: Given that X 19 20 21 22 23 P(X) 0.4 0.2 0.2 0.1 0.1 Mean = E(X)=∑X.P(X) Var(X)=E(X2) -…
Q: Suppose a mathematics class with 30 students is given an examination and the raw scores are shown…
A: Note, Since you have posted a question with multiple sub-parts, we will solve first three sub-parts…
Q: ENTRY CARD Compute the variance of this frequency distribution. Score Number of Students 3 8 10 4.…
A: For the given data Find Mean =? Variance =?
Q: 2. A pet association claims that the mean annual costs of food for dogs and cats are the same. The…
A: Given that A pet association claims that the mean annual costs of food for dogs and cats are the…
Q: Find Mean , Modal class , variance, and standard deviation for this grouped data of a sample: class…
A: Solution: Class(1) Frequency (f)(2) Mid value (x)(3) f⋅x(4)=(2)×(3) f⋅x^2=(f⋅x)×(x)(5)=(4)×(3)…
Q: The lifetime of watch batteries follow a normal distribution with mean 100 hours and variance 49…
A: Let X be the random variable from normal distribution with mean (μ) = 13, variance (σ2)= 49 then…
Q: Consider that X1, X2, X3, X4, X5 is an independent random sample where Xi follows a normal…
A:
Q: 4,9,6,4,11,14 (b) Use the Alternate Formula for Sample Variance to find the variance and standard…
A: Formula : Sample variance : s2=∑x2-∑x2nn-1 Sample standard deviation : s =s2
Q: a) Frequency (f) fx X? efi 15 6 90 1350 225 6 20 11 220 4400 400 17 25 17 425 10625 625 34 30 24 720…
A: Note: "Since you have posted a question with multiple sub -parts, we will solve first three sub…
Q: r the data above, what is the pooled variance? (Hint: you must first find the variance for each )
A: Given : For group A given data : 12,10,7,7,8,5
Q: In the data set below, what is the variance? 3 7 2 8 5 9 1 If the answer is a decimal, round it to…
A: Given data (3,7,2,8,8,9,1) n=7
Q: Icular country A Click the icon to view the data. Data table For the download speed and the upload…
A:
Q: Monthly electric bills of householders in Muscat are normally distributed with a mean of OMR 25 and…
A: Let X denote the monthly electric bills of households in muscat and it follows normal distribution…
Q: - For the data in table (1): Draw the frequency distribution diagram. Find the class mark. Find the…
A: Solution: Variance=5.1854 and sd=2.2771
Q: The numbers of absent days a student had in the last five months are {0, 4, 2, 0, 3}. What is the…
A:
Q: Use the data set of years of employment in the simple random sample of local residents 20 18 23 30…
A: Given data is 20,18, 23,30, 20 , 9, 25 , 15 , 8 , 11 ,34Arrange the given data in ascending order 8,…
Q: If the deviations six of values from their mean are 0, -6, 7,-2,5,-4 then the sample variance equal…
A:
Q: A: Find the standard deviation and variance of the following data classes 10- 13- 16- 19-22 freq B:…
A:
Q: Calculate the variance and standard deviation for the students score data. Score 10-14 15-19 20-24…
A: Obtain the value of the standard deviation for the students score data. The value of the standard…
Q: How to solve for question 2-4?
A: Question 2: Sample statistics of the two samples:The given statistics for the two randomly selected…
Q: The following data provided are the average hours fifty-six grade 8 students spent doing their…
A: Range is the difference between largest and smallest observation. And variance is the measure of…
Q: Example 16. The Mean, Mode and Q.D. of a distribution are 42, 36 and 15 respectively. If its…
A: Given that, the mean, mode and Q.D. of a distribution are 42,36 and 15 respectively. Its Bowley's…
Q: If the final averages form semester 1 and 2 are assumed to be normally distributed with qual…
A: Since you have asked question with multiple parts we will solve the first three sub-parts for you.…
Q: Q3. Find the range, mean, variance, and standard deviation of the sample data set. 4 15 9 12 16 8 11…
A: Given data, 4,15,9,12,16,8,11,19,14
Q: 1. Which of the following is a measure of central tendency? a. Quartiles b. Percentiles c. Standard…
A: As per our guidline we can solve maximum one question or three subpart
Q: Determine the following:a. The value of a consistent with N = 6 in moving averages.b. The value of N…
A: a) Consider the relation N+12=1αα=2N+1N=2α-1 The required value is calculated as follows: α=2N+1…
Q: Q.) CONSTRUCT FREQUENCY DISTRIBUTION TABLE AND FIND: 1) MEDIAN AND MODE. 2) Variance and standard…
A:
Q: 10. Using sample variance, find Coefficient of Variation (CV) for the following data. 5 - 10 10 - 15…
A: Given, X f 5-10…
Q: Find the mean, variance, and standard deviation for each set of data. 南打|| 3-8 1 8 - 13 13 - 18 18 -…
A:
Q: Given the fuel economy data shown in the frequency Distribution at the right, what are the…
A: Here, the first lower and upper case limits are 22 and 27. Then, the midpoint of the class is 24.5…
Q: XYZ office supplies company leases copier machines to businesses. Leases are normally distributed…
A: Given,mean(μ)=24standard deviation(σ)=6
Q: Given the following data: Data 1 Data 2 1 1 4 5 5 5 6 5 8 8…
A:
Q: X is a point estimator of: Select one: a. Population mean b. Sample mean c. Sample variance d.…
A:
Q: Q2 – For the data in table (1): / 1- Draw the frequency distribution diagram. 2 - Find the class…
A: (1) Draw the frequency distribution diagram. The frequency distribution diagram is plotted below as…
Q: Find the mean, variance, and standard deviation for each set of data. 南計| 1. 3-8 1 8- 13 19 2 13 -…
A: We have to find the mean, variance, standard deviation.
Q: The durability of the hacksaw is measured in a quality control laboratory. A standard saw needs 2500…
A: To test:H0:μ=2500H1:μ>2500
Q: (B) Flow fate was mC pred for a week, and the following values were recorded as gai/min: 9.7, 8.8,…
A:
Q: and if the scores A set of 10 scores has SS= 90. If the scores are a sample, the sample variance is…
A: Population variance ,σ2, tells us how data points in a specific population are spread out. It is the…
Q: #9 please fine the mean variance, standard deviation
A:
Q: o the population variance
A: Generally, we obtain the variance based on the sample data but if in the problem there is mention…
Q: ii) Find the mean and variance of the statistic T = Σ117,7
A: It is given that Zi and Wi follows Standard Normal distribution i.e N(0,1).
Q: At a 0.05, test to see if the population variances from which the following samples were drawn are…
A:
Q: Find the range, quartile deviation, mean deviation about the mean, mean deviation about the median,…
A: given , class frequency 2-4 2 4-6 5 6-8 4 8-10 7 Total 18

Step by step
Solved in 2 steps with 2 images
