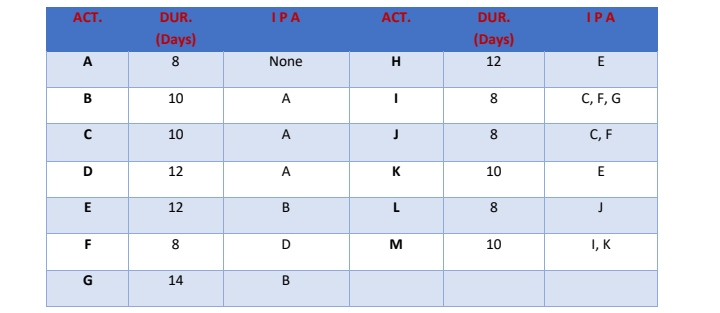
Given the tabulated data shown, prepare the PERT / CPM or arrow diagram and identify the critical path.


Q: Draw the PDM network diagram for the following project, calculate the earliest and latest starting…
A: 1. During forward pass in case of more than two preceding activities the early start will be…
Q: . Draw a precedence diagram using AOA. b. Find the critical path. c. Determine the expected length…
A: Below is the solution:-
Q: What characteristic(s) of the critical path times makes them critical? What two factors are compared…
A: Critical path activities are those that, if delayed, will cause the project's completion to be…
Q: In February 2017 the Team Project Manager and Flow Project Coordinator for Dell…
A: The summary of the case brought to light important issues and elements. In order to finish the…
Q: The Mama Lit is a restaurant near a project site and it is a direct supplier of food for the nearby…
A: a) Network Diagram
Q: Draw the network diagram for the whole project (with AoN Activity on Node)
A: Activity-on-node could be a project management term that refers to a precedence schematization…
Q: a) Create the AoA diagram for activiies A thru K, in the proper AaA format as discussed in the PM…
A: The critical path can be determined by drawing the networks in two ways: Arrow to Arrow (AOA) and…
Q: Why is it critical to determine the sequence of activities in a project? Name diagrams that resemble…
A: A project can be defined as a series of tasks that are to be completed in order to achieve a goal or…
Q: Draw the CPM network and identify the critical path. How many weeks will the projec require under…
A: A network diagram is a representation of a project which helps to know the activity relationship…
Q: Consider following data. Draw activity on arc (AOA) network diagram. Find out critical path,…
A: A project schedule network diagram shows the sequence of the task that are performed to complete a…
Q: Construct a network diagram for the project. a. b. What are the project completion time and the…
A: Honor Code: Since you have posted a question with multiple subparts, we have solved the first three…
Q: (c) Determine the ES, EF, LS, LF, and slack time for each activity. (d) Determine the total…
A: Solution: c) Excel formulas
Q: a. Construct AON diagram for the following data. b. Identify critical path. c. Conduct CPM analysis…
A: Project network is the graphical representation of project activities and their duration to complete…
Q: Show the project schedule by drawing Gant Chart in Microsoft excle for the given data:- (10)…
A: Given data is
Q: Using the diagram, find: The critical path. How long it will take to complete the project?
A: Activity Expected time A 10 B 7 C 5 D 7 E 11 F 3 G 5 Paths : A-C-F : 10 + 5 + 3 =…
Q: a. Calculate ALL the missing (?) data points. b. Draw the PERT network from the given data. c.…
A: NOTE: We are allowed to do the first three sub-parts only. PERT is a project management tool used…
Q: Path QRT will take how many days? ( Select] The critical path is? [ Select] The duration of the…
A: Since you have posted a question with multiple sub-parts, we will solve the first three subparts for…
Q: Suppose you are a project manager, and you have to manage a project with activities and their…
A: Task Duration Predecessors A 5 B 8 A C 3 B D 4 A E 5 C F 7 C G 6 D, E H 8 F I…
Q: Four Squares Productions, a firm hired to coordinate the release of the movie Pirates oft he…
A: A network diagram is a graphical depiction of a project that uses a sequence of connected arrows and…
Q: probability. The actual time period for the completion of the project within the PERT technology?
A: ANSWER IS GIVEN BELOW:
Q: Three activities are candidates for crashing on a projectnetwork for a large computer installation…
A: Critical path is the sequence of dependent tasks that form the longest duration, allowing you to…
Q: Muhammad Khan supervises a group of seven project engineers. His unit is experiencing a heavy…
A: Delegation is a win-win when done in a right manner, however, this doesn’t imply that a supervisor…
Q: Given the tabulated data shown, prepare the PERT / CPM or arrow diagram and identify the critical…
A: PERT/CPM diagram will helps to identify the critical path using forward and backward passing…
Q: Given the following data below, draw the AON diagram and fill out the table below: Answer the…
A: 1.
Q: a)Construct AON diagram for the following data. b) Identify path, path duration and critical path c)…
A: Below is the solution:-
Q: Using the following data for a small maintenance project, do the following activities: a. Draw the…
A: A project network is a network that represents the project activities and their duration to complete…
Q: Create a PERT diagram and find the critical path for the same with example
A: Assume the following data for a process:
Q: Draw the network diagram and determine the minimum total time (in weeks) using the concept of…
A: Project crashing is a process which helps to reduce the total project completion time using…
Q: Create a PERT diagram using the below details,
A: The PERT (program evaluation and review technique) is the project management technique that is used…
Q: Which one is NOT a basic output of a PM network analysis? Select one: a. Identification of the…
A: One of the important tools that are widely used in project management is network analysis. It is…
Q: 1. Calculate the expected duration and the standard deviation for the critical path.
A: YOUR ANSWER IS GIVEN BELOW:
Q: Build a PERT Network Diagram for a 3-month project with 6 activities (A to F) and 5 nodes
A: The answer is as below:
Q: How does activities along the critical path of a network diagram impacts the project as a whole?
A: Project management has mainly two types of techniques such as PERT analysis and CPM analysis. CPM is…
Q: Draw a network with t, ES, EF, LS, LF.
A: A network diagram is a graphical representation of a project which visualizing the relationship…
Q: snip
A: Total activity =4 Standard deviations of each activities = 1,2,4 and 2 respectively
Q: Show the project schedule by drawing Gant Chart in Microsoft excle for the given data:- Activity…
A: Given data is
Q: a. Draw a precedence diagram using AOA , AON and Gantt chart. b. Find the critical path using CPM.…
A: Below is the solution:-
Q: Make an analysis of Critical Path Method (CPM) in four steps?
A: The critical path methods (CPM) refers to the step-by-step process of the project management to…
Q: 1. Why did Global Green Books Publishing struggle? 2. What kind of suggestions would you give to…
A: Project management is the use of detailed knowledge, skills, tools, and techniques to deliver…
Q: For each of the following network diagrams, determine both the critical path and the expected proj-…
A: The network diagrams for critical path can be constructed in two ways: Arrow to Node - AON Arrow to…
Q: Based on the Table 1, using Critical Path Method (CPM) diagram, determine the ES, EF, LS & LF,…
A:
Q: Refer to the table given to answer the following question: 1. Which PERT diagram best represents the…
A: Given data is
Q: How is the variance of the total project computed inPERT
A: Project management scheduling contains a list of a project related activities and deliverables,…
Q: The VOXN Cinema is installing a new system to enhance the quality of movies shown. Assume that the…
A: A. List of possible eight events to expand a Cinema: Find a location Build up the area Frame and…

Step by step
Solved in 2 steps with 1 images

- 16.6 which type of graph would you recommend to show each of the following? why? A. A comparison of changes in average annual per capita income for the United States and japan from 2000 to 20018. B. The percentage compositiion of average family expenditure patterns, by the major types of expenditures, for families whose heads are under age 35 compared with families whose heads are 55 or older. C. A comparaison of the changes in charitable giving between December 21, 2007 and December 31, 2017.Some new product launches fail and this leaves a negative impact on the profitability of the company. Using a particular product as an example, discuss1. Some of the key determinates and conditions that need to be met to launch that product successfully on the market; 2. What may go wrong with the launch of that product and why? 3. What steps should the company launching the product take in order to mitigate product launch failure or to address the situation in the event of a failure of the launch of that productTheir board of directors in 2014 was delighted with their cash flow and profits. However, they were concerned about future growth because of changing diets of many consumers who had become more concerned about consuming milk-based products. The company had already added low-fat versions of the major products but the board members were concerned that this would not be sufficient to sustain their growth and profits. Some possibilities that were suggested for consideration included (1) setting up a new company to produce non-dairy-based products such as almond milk and other alternatives to cow milk. All the new products would have a healthy “spin” such as the White Wave company; (2) market expansion of their existing product lines into Mexico and Central America; (3) expanding their current product offerings by adding ice cream, high-end cheeses made from goat and sheep milk, and high-end milk-based candy; and (4) a combination of one or more of these alternatives. 1. Evaluate all…
- YEAR ADVERTISING EXPENDITURE ($000) MEMBERSHIP SUBCRIPTIONS 2013 51 62 2014 58 68 2015 62 66 2016 65 66 2017 68 67 2018 76 72 2019 77 73 2020 78 72 2021 78 78 2022 84 73 2023 85 76 i) Plot the scattergraph for the data. (ii) Use the data, to develop a regression equation relating advertising expenditure to membership. (iii) Estimate the membership if $40 000 is spent on advertising. (iv) How much must be spent on advertising to obtain a membership of 80 (000)? (iv) What is the nature of the relationship between advertising expenditure and membership? (v) Forecast 2024 membership using an alternative method, clearly explaining the limitations of your selected method. (vi) What are the limitations of the method used in (i)?Lefola Limited is the only manufacturer of product G_Easy in the Popa Land. It has provided documented levels of demand at certain selling prices for product G_Easy which are as follows:Price per unit 7 0006 000Demand Units 01Total costs 3 0005 000875 000 2 4 000 3 3 000 4 2 000 5 1 000 68 000 12 000 17 000 23 000 30 000Required:MGA40AT/POF117V – 2020 Instructional Teaching manual packUsing a tabular approach, calculate the marginal revenues and marginal costs for product G_Easy at the different levels of demand, and so determine the selling price at which Lefola Limited’s profits are maximized.Consider the following table: SS DF MS F Among Treatments 1 611.92 Error 448.64 Total 5995.6 13 Step 1 of 8: Calculate the sum of squares among treatments. Please round your answer to two decimal places. Step 2 of 8: Calculate the sum of squares of experimental error. Please round your answer to two decimal places. Step 3 of 8: Calculate the degrees of freedom of experimental error. Step 4 of 8: Calculate the F-value. Please round your answer to two decimal places. Step 5 of 8: What is the sum of squares of sample means about the grand mean? Please round your answer to two decimal places. Step 6 of 8: What is the variation of the individual measurements about their respective means? Please round your answer to two decimal places. Step 7 of 8: What is the critical value of F at the 0.01 level? Please round your answer to four decimal places, if necessary. Step 8 of 8: Is F significant at 0.01?
- Topic: Globla Health GrenCHAP was founded in 2001 with a primary focus on Men who have Sex with Men (MSM), in response to the regional partnership between The Global Fund and PANCAP. The Global Fund is a unique global public/private partnership dedicated to attracting and disbursing additional resources to prevent and treat HIV/AIDS, Tuberculosis and Malaria. It is active in the Caribbean and provides major funding to the Pan Caribbean Partnership Against HIV/AIDS (PANCAP) for the region’s response to HIV/AIDS. Today, GrenCHAP Inc. is a non-governmental organisation working to promote Sexual Reproductive Health and Human Rights, with a focus on marginalised populations, such as LGBT and Sex Workers. Over the years, our workplan has received financial support from the U.S. President’s Emergency Plan for AIDS Relief (PEPFAR), the Caribbean HIV/AIDS Alliance, amfAR, and, at present the Open Society Foundations (OSF). Question: What are the major forces of their work ?In 2020, a manufacturing company instituted a total quality management (TQM) program producingthe comparative report shown below:[LO 17-5]Summary COQ Report(in thousands)2019 2020 % ChangePrevention costs $ 200 $ 300 +50Appraisal costs 210 315 +50Internal failure costs 190 114 −40External failure costs 1,200 621 −48Total COQ $1,800 $1,350 −25On the basis of this report, which one of the following statements is most likely correct?a. An increase in conformance costs resulted in a higher-quality product and, therefore, a decreasein nonconformance costs.b. An increase in inspection costs was solely responsible for the decrease in quality costs.c. Quality costs such as scrap and rework decreased by 48%.d. Quality costs such as returns and repairs under warranty decreased by 40%.e. Nonconformance costs increased by 50% and conformance costs decreased by approximately 47%.true/false 1. The add for the winter Olympics in Beijing 2022 by the company Lululemon was "Team Canada x Lululemon Collection represents the courage, strength, and collaboration required to compete at the highest levels". This add is consistent with persuasive and complementary advertising but not informative advertising. 2. Hastings, Hortacsu and Syverson in 2013 present evidence on how informative advertising shapes competition in a case study of Mexican privatized pension funds. 3. The case study of Heinz ketchup, cited in the textbook, was that of an add that emphasized the "thickness" of its ketchup. It was found empirically to have decreased the price elasticity demand of the product. This advertising effect is consistent with persuasive advertising and not informative advertising.
- The following table shows quarterly sales (in thousand units) for a product over 4 years. The overall sales average for the entire 4 years is 126.0625 (thousand units).Fill in the missing values assuming there is no trend.Round seasonal indexes to 4 decimal places.Report Averages accurate to at most 2 decimal places.Report Actual sales ('000) accurate to the nearest integer. Year 1 Year 2 Year 3 Year 4 Average Seasonal Index Quarter 1 92 93 95 106 Quarter 2 105 106 105 101 Quarter 3 197 187 196 1.5211 Quarter 4 106 116 121 0.8865 PART BSuppose actual quarterly sales (in thousands) for Year 5 are 93, 123, 206, and 126 respectively. Assuming there is no trend, forecast sales for the four quarters of Year 5.Use seasonal indexes (rounded to 4 decimal places) from Part A.Report forecast answers as integers accurate to the nearest thousand.Quarter 1 forecast = thousandQuarter 2 forecast = thousandQuarter 3 forecast = thousandQuarter 4 forecast =…What can be the suffering 0f marketing myopia f0r any 0rganizati0n or C0many in the market? H0w can we prevent it and Explain it with exampleQ1) Ahmed's interest was cricket. When he finished university, he wanted to work in a management job. He wanted to do his research project on some aspect of general management and social sciences, preferably for a sports goods manufacturer but had no research idea. He asked five friends, all taking business education degrees, to help him brainstorm the problem. You are requested to use the following problem-solving techniques to generate and refine the research idea in this business scenario. i) The technique of Brainstormingii) The Delphi technique