Glaucoma is a leading cause of blindness in the United States, N. Ehlers measured the difference in corneal thickness (in microns) between the two eyes of eight patients. Each patient had one eye that had glaucoma and one eye that was normal. The difference was measured as the corneal thickness of normal eye – corneal thickness of eye with Glaucoma. Corneal thickness is important because it can mask an accurate reading of eye pressure. Use ? = .05. Q)Conduct a hypothesis test to determine if there is sufficient evidence to conclude that corneal thickness is different in normal eyes compared to eyes with glaucoma? Write up your results using the 8 steps.


Glaucoma is a leading cause of blindness in the United States, N. Ehlers measured
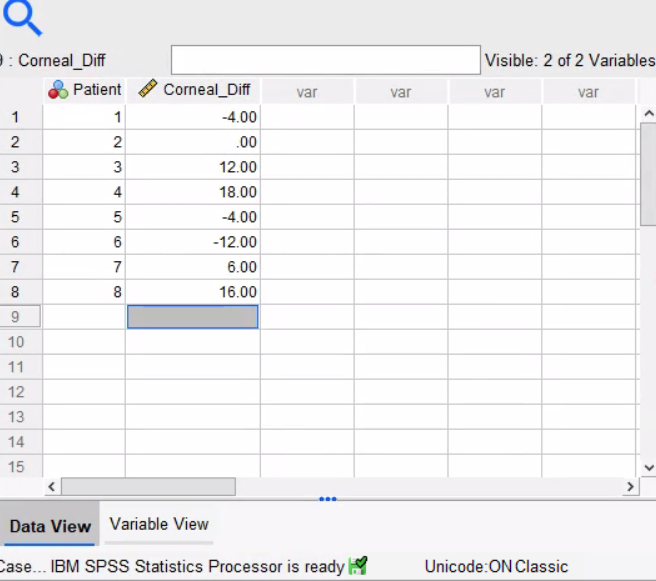
the difference in corneal thickness (in microns) between the two eyes of eight patients.
Each patient had one eye that had glaucoma and one eye that was normal. The
difference was measured as the corneal thickness of normal eye – corneal thickness
of eye with Glaucoma. Corneal thickness is important because it can mask an
accurate reading of eye pressure.
Use ? = .05.
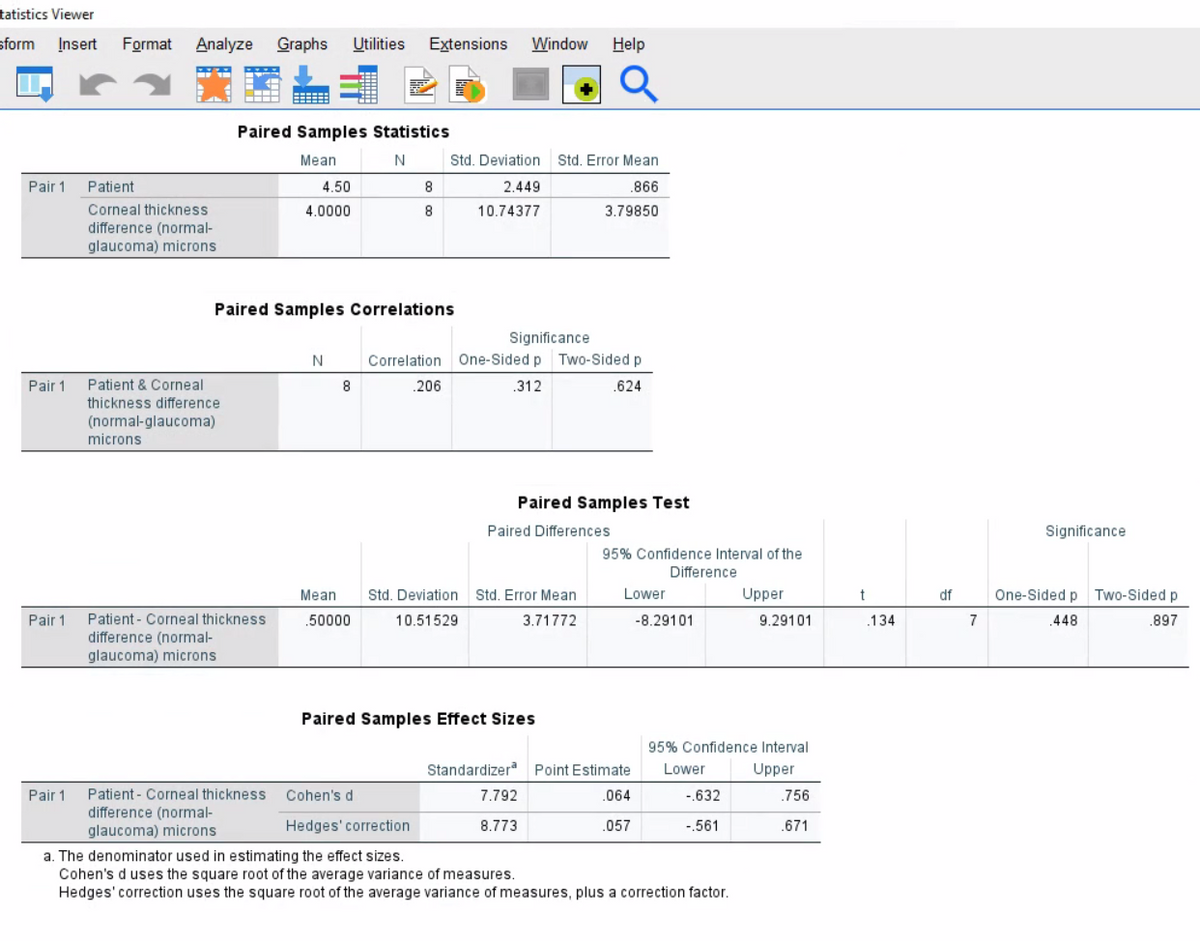
Q)Conduct a hypothesis test to determine if there is sufficient evidence to
conclude that corneal thickness is different in normal eyes compared to eyes
with glaucoma? Write up your results using the 8 steps.

Step by step
Solved in 2 steps with 1 images

Write a report summarizing your findings. When writing the
report consider that medical staff estimate that a difference of 4.5 microns
or more could impact on their ability to interpret eye pressure correctly.