gnment 0988.... ard.com uick erly Zal... ge mortgage. nts App S... Galore ore.com art Shop "iew all... e Light'- -taup... DO discove... Portal c.com emote lid user... k m e to one, or... tion.com on ing arson.co indow course... Name Section 4.1 Below a scatter diagram for x and y. The sample correlation coefficient for the data r = -0.823. 100 90 80 70 60 -50 40 30 20 10 0 0 ● Show all your work 5 10 ● ● 15 · 20 ● 25 ● 30 35 Is there a linear correlation between x and y? Use the "Critical Values for Correlation Coefficient" table provided to justify your answer. If there is linear correlation, is it positive or negative? n 3 4 5 6 7 9 Critical Values for Correlation Coefficient 0.997 10 0.632 17 0.950 11 0.602 18 0.878 12 0.576 19 0.811 13 0.553 20 14 0.754 0.532 21 0.707 15 0.514 22 0.666 16 0.497 23 n 0.482 24 0.468 25 0.456 26 27 0.444 0.433 28 0.423 29 0.413 30 0.404 0.396 0.388 0.381 0.374 0.367 0.361 The statistical relationship between two variables is known as correlation. It is denoted by r. r lies between-1 to +1. From the scatter diagram - Yes, there exists a linear correlation between x and y. For n=7, the critical value is 0.754. r=-0.823 The absolute correlation coefficient is greater than the critical value. b) There exists a negative correlation between X and Y. As, it comes down in the scatter diagram.
gnment 0988.... ard.com uick erly Zal... ge mortgage. nts App S... Galore ore.com art Shop "iew all... e Light'- -taup... DO discove... Portal c.com emote lid user... k m e to one, or... tion.com on ing arson.co indow course... Name Section 4.1 Below a scatter diagram for x and y. The sample correlation coefficient for the data r = -0.823. 100 90 80 70 60 -50 40 30 20 10 0 0 ● Show all your work 5 10 ● ● 15 · 20 ● 25 ● 30 35 Is there a linear correlation between x and y? Use the "Critical Values for Correlation Coefficient" table provided to justify your answer. If there is linear correlation, is it positive or negative? n 3 4 5 6 7 9 Critical Values for Correlation Coefficient 0.997 10 0.632 17 0.950 11 0.602 18 0.878 12 0.576 19 0.811 13 0.553 20 14 0.754 0.532 21 0.707 15 0.514 22 0.666 16 0.497 23 n 0.482 24 0.468 25 0.456 26 27 0.444 0.433 28 0.423 29 0.413 30 0.404 0.396 0.388 0.381 0.374 0.367 0.361 The statistical relationship between two variables is known as correlation. It is denoted by r. r lies between-1 to +1. From the scatter diagram - Yes, there exists a linear correlation between x and y. For n=7, the critical value is 0.754. r=-0.823 The absolute correlation coefficient is greater than the critical value. b) There exists a negative correlation between X and Y. As, it comes down in the scatter diagram.

MATLAB: An Introduction with Applications
6th Edition
ISBN:9781119256830
Author:Amos Gilat
Publisher:Amos Gilat
Chapter1: Starting With Matlab
Section: Chapter Questions
Problem 1P

Related questions
Question
can you show me more work on the diagram
Transcribed Image Text:https://learn-us-east-1-prod-fle...
B
Search Reading List
O
ncare & Cosmet
Y
O
„
|
All
C
R
Unread
PROVINCE
MORTGAGE
mobile myloan.provincemortgage.
Extra Credit Assignment
- MTH-119-A09 90988....
bristolcc.blackboard.com
Skip To ContentQuick
Links Logout Kimberly Zal...
Province Mortgage
Associates, Inc.
Mail - Zaldivar, Kimberly - Outlo...
com
My Loan Documents
Calculator Get The App S...
Sweet Organics Galore
sweetorganicsgalore.com
Skip to content Cart Shop
Our Best-Sellers View all...
Yeezy 500 'Taupe Light' -
Adidas - GX3605- taup...
flightclub.com
Shop the Yeezy 500
'Taupe Light' and discove...
Remote Access Portal
access.genesishcc.com
Welcome to the Remote
Access Portal Invalid user...
Sign in to Outlook
outlook.office.com
Sign in to continue to
Outlook Email, phone, or...
Connect
connect.mheducation.com
Register | Pearson
MyLab & Mastering
registration.mypearson.co
m
opens in a new window
Register Find your course...
Name
100
90
80
70
60
50
40
30
20
10
0
Announcements - MTH-119-A5...
0
learn-us-east-1-prod-fleet02-xythos.content.blackboardcdn.com
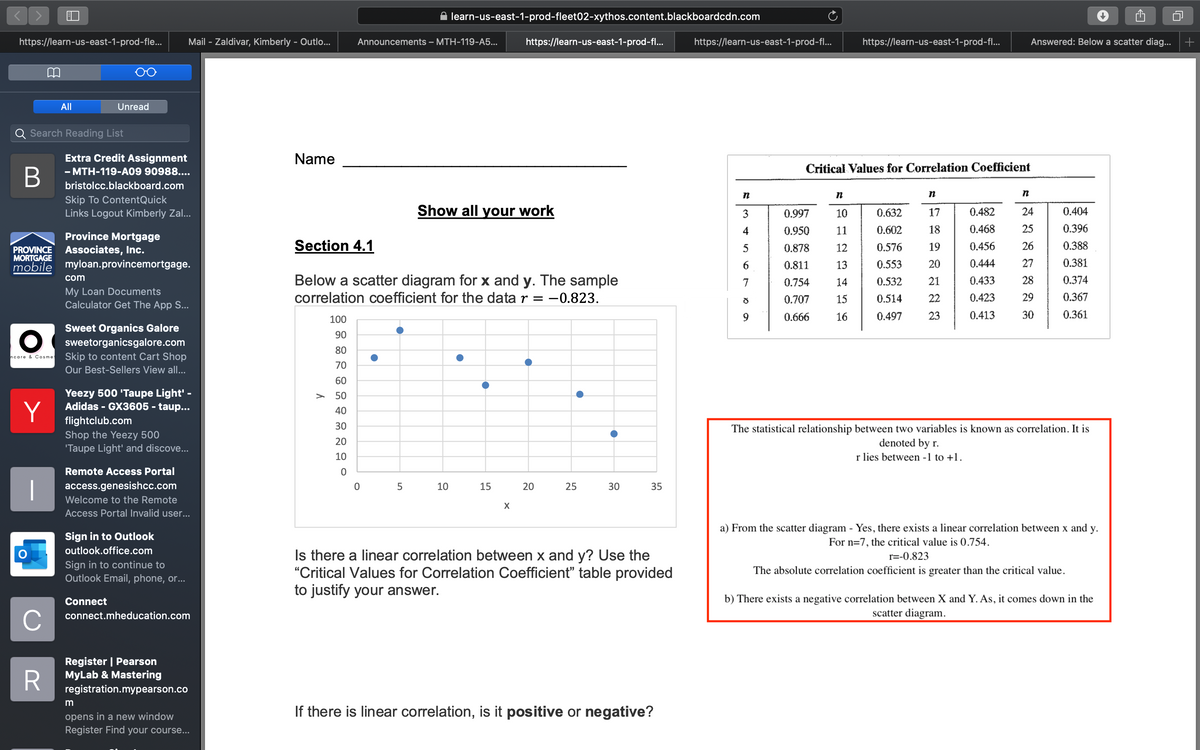
Section 4.1
Below a scatter diagram for x and y. The sample
correlation coefficient for the data r = -0.823.
5
Show all your work
10
https://learn-us-east-1-prod-fl...
15
X
20
25
30
35
Is there a linear correlation between x and y? Use the
"Critical Values for Correlation Coefficient" table provided
to justify your answer.
If there is linear correlation, is it positive or negative?
https://learn-us-east-1-prod-fl...
n
3
4
5
0.997
0.950
0.878
0.811
0.754
0.707
0.666
https://learn-us-east-1-prod-fl...
Critical Values for Correlation Coefficient
n
10
11
12
13
14
15
16
0.632
0.602
0.576
0.553
0.532
0.514
0.497
n
17
18
19
20
21
22
23
0.482
0.468
0.456
0.444
0.433
0.423
0.413
Answered: Below a scatter diag... +
n
24
25
26
27
28
29
30
0.404
0.396
0.388
0.381
0.374
0.367
0.361
The statistical relationship between two variables is known as correlation. It is
denoted by r.
r lies between -1 to +1.
a) From the scatter diagram - Yes, there exists a linear correlation between x and y.
For n=7, the critical value is 0.754.
r=-0.823
The absolute correlation coefficient is greater than the critical value.
b) There exists a negative correlation between X and Y. As, it comes down in the
scatter diagram.
Expert Solution
This question has been solved!
Explore an expertly crafted, step-by-step solution for a thorough understanding of key concepts.

This is a popular solution!

Trending now
This is a popular solution!

Step by step
Solved in 3 steps with 1 images

Recommended textbooks for you
MATLAB: An Introduction with Applications
Statistics
ISBN:
9781119256830
Author:
Amos Gilat
Publisher:
John Wiley & Sons Inc

Probability and Statistics for Engineering and th…
Statistics
ISBN:
9781305251809
Author:
Jay L. Devore
Publisher:
Cengage Learning

Statistics for The Behavioral Sciences (MindTap C…
Statistics
ISBN:
9781305504912
Author:
Frederick J Gravetter, Larry B. Wallnau
Publisher:
Cengage Learning
MATLAB: An Introduction with Applications
Statistics
ISBN:
9781119256830
Author:
Amos Gilat
Publisher:
John Wiley & Sons Inc
Probability and Statistics for Engineering and th…
Statistics
ISBN:
9781305251809
Author:
Jay L. Devore
Publisher:
Cengage Learning
Statistics for The Behavioral Sciences (MindTap C…
Statistics
ISBN:
9781305504912
Author:
Frederick J Gravetter, Larry B. Wallnau
Publisher:
Cengage Learning

Elementary Statistics: Picturing the World (7th E…
Statistics
ISBN:
9780134683416
Author:
Ron Larson, Betsy Farber
Publisher:
PEARSON

The Basic Practice of Statistics
Statistics
ISBN:
9781319042578
Author:
David S. Moore, William I. Notz, Michael A. Fligner
Publisher:
W. H. Freeman

Introduction to the Practice of Statistics
Statistics
ISBN:
9781319013387
Author:
David S. Moore, George P. McCabe, Bruce A. Craig
Publisher:
W. H. Freeman