Graph A Graph B Graph C Graph D Which of the above 4 graphs best represents the change in the PPF if the economy decides to place a heavy tax on the firms producing the good represented on the vertical axis?
Graph A Graph B Graph C Graph D Which of the above 4 graphs best represents the change in the PPF if the economy decides to place a heavy tax on the firms producing the good represented on the vertical axis?

Chapter2: Production Possibilities Frontier Framework
Section: Chapter Questions
Problem 8QP

Related questions
Question
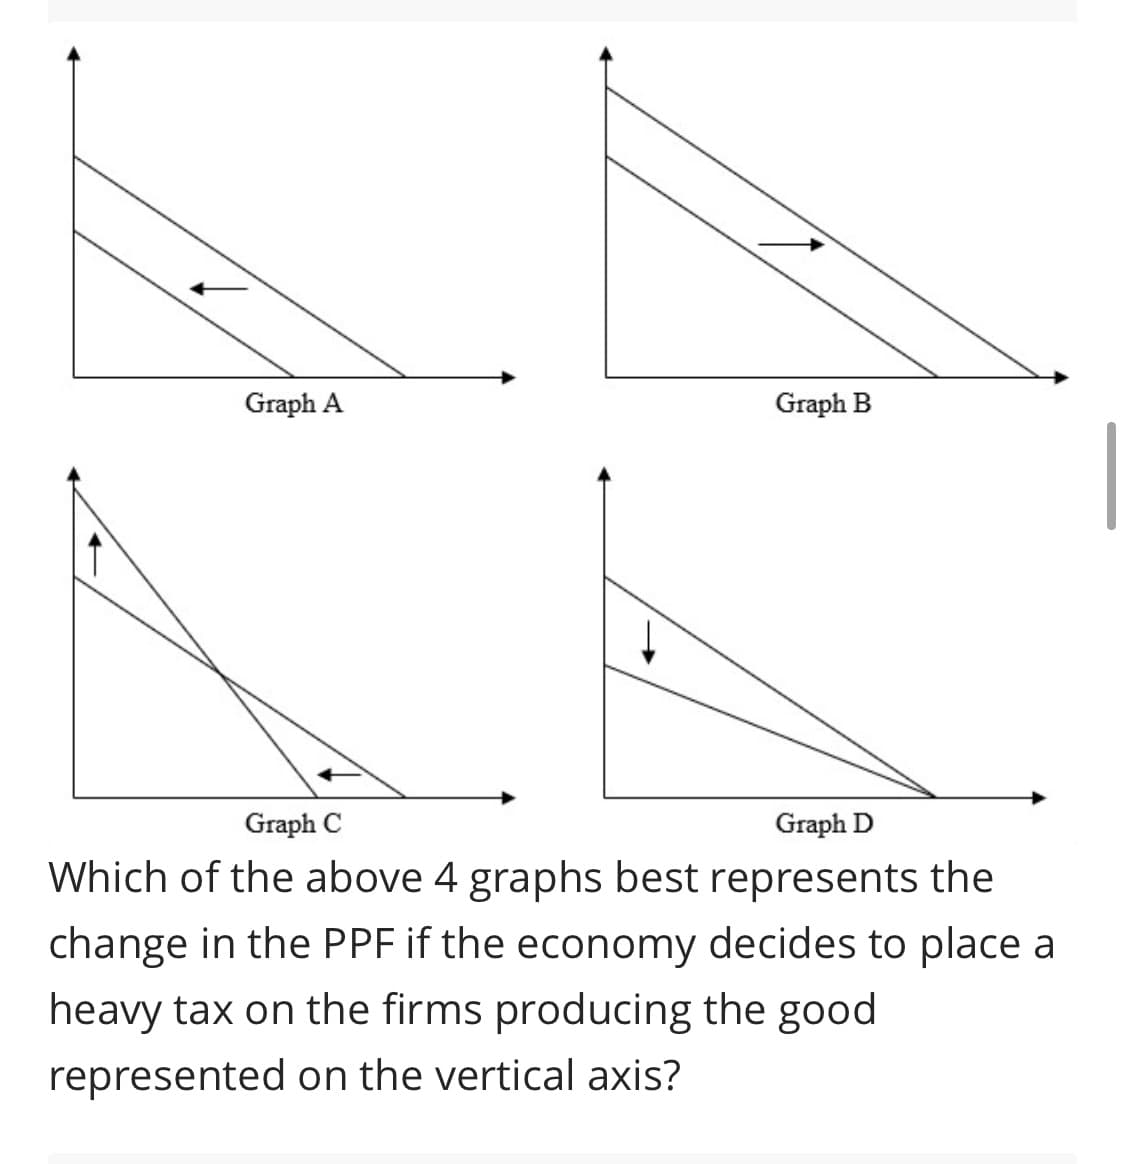
Transcribed Image Text:Graph A
Graph B
Graph C
Graph D
Which of the above 4 graphs best represents the
change in the PPF if the economy decides to place a
heavy tax on the firms producing the good
represented on the vertical axis?
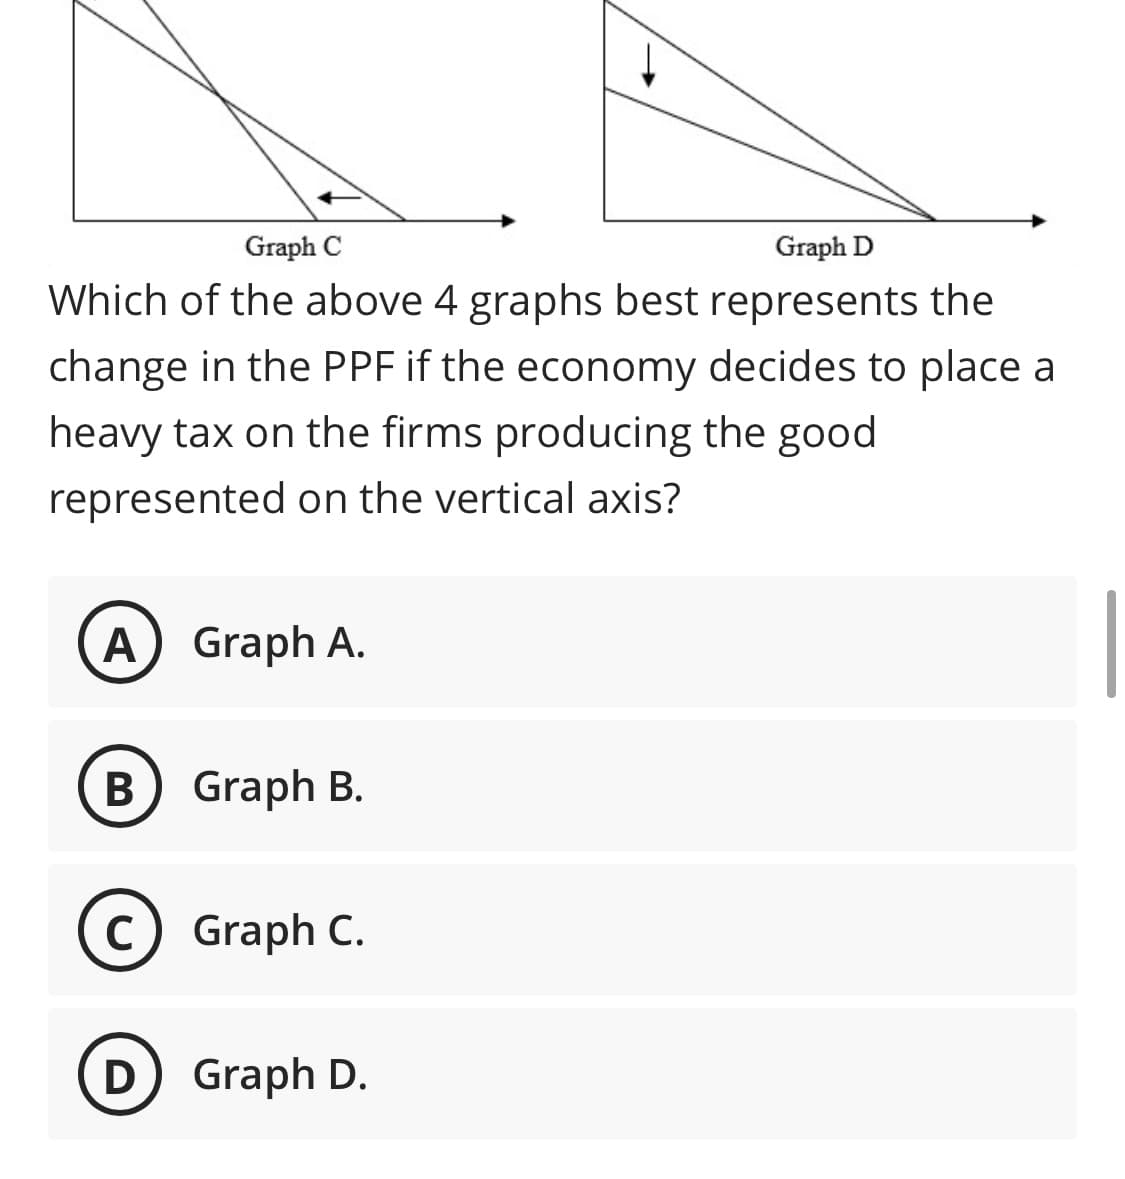
Transcribed Image Text:Graph C
Graph D
Which of the above 4 graphs best represents the
change in the PPF if the economy decides to place a
heavy tax on the firms producing the good
represented on the vertical axis?
Graph A.
В
Graph B.
C Graph C.
D Graph D.
Expert Solution
This question has been solved!
Explore an expertly crafted, step-by-step solution for a thorough understanding of key concepts.

This is a popular solution!

Trending now
This is a popular solution!

Step by step
Solved in 2 steps

Knowledge Booster


Learn more about
Need a deep-dive on the concept behind this application? Look no further. Learn more about this topic, economics and related others by exploring similar questions and additional content below.Recommended textbooks for you


Economics (MindTap Course List)
Economics
ISBN:
9781337617383
Author:
Roger A. Arnold
Publisher:
Cengage Learning
Economics (MindTap Course List)
Economics
ISBN:
9781337617383
Author:
Roger A. Arnold
Publisher:
Cengage Learning

Principles of Economics 2e
Economics
ISBN:
9781947172364
Author:
Steven A. Greenlaw; David Shapiro
Publisher:
OpenStax


Exploring Economics
Economics
ISBN:
9781544336329
Author:
Robert L. Sexton
Publisher:
SAGE Publications, Inc