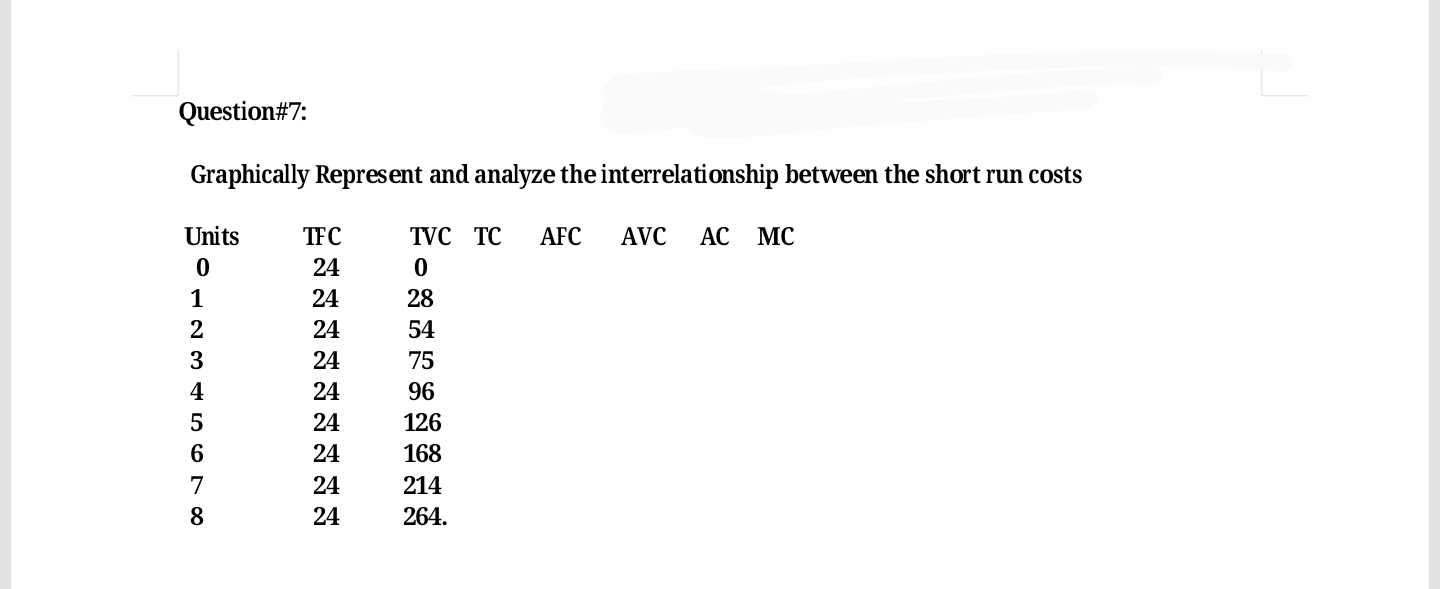
Graphically Represent and analyze the interrelationship between the short run costs Units TFC TVC TC AFC AVC AC MC 24 1 24 28 2 24 54 3 24 75 4 24 96 5 24 126 24 168 7 24 214 8 24 264.
Graphically Represent and analyze the interrelationship between the short run costs Units TFC TVC TC AFC AVC AC MC 24 1 24 28 2 24 54 3 24 75 4 24 96 5 24 126 24 168 7 24 214 8 24 264.

Chapter6: Proudction Costs
Section: Chapter Questions
Problem 9SQP

Related questions
Question
solve the question
Transcribed Image Text:Graphically Represent and analyze the interrelationship between the short run costs
Units
TFC
TVC TC
AFC
AVC
AC MC
24
1
24
28
2
24
54
3
24
75
4
24
96
5
24
126
24
168
7
24
214
8
24
264.
Expert Solution
This question has been solved!
Explore an expertly crafted, step-by-step solution for a thorough understanding of key concepts.

This is a popular solution!

Trending now
This is a popular solution!

Step by step
Solved in 2 steps with 4 images

Knowledge Booster


Learn more about
Need a deep-dive on the concept behind this application? Look no further. Learn more about this topic, economics and related others by exploring similar questions and additional content below.Recommended textbooks for you


Managerial Economics: A Problem Solving Approach
Economics
ISBN:
9781337106665
Author:
Luke M. Froeb, Brian T. McCann, Michael R. Ward, Mike Shor
Publisher:
Cengage Learning


Economics (MindTap Course List)
Economics
ISBN:
9781337617383
Author:
Roger A. Arnold
Publisher:
Cengage Learning