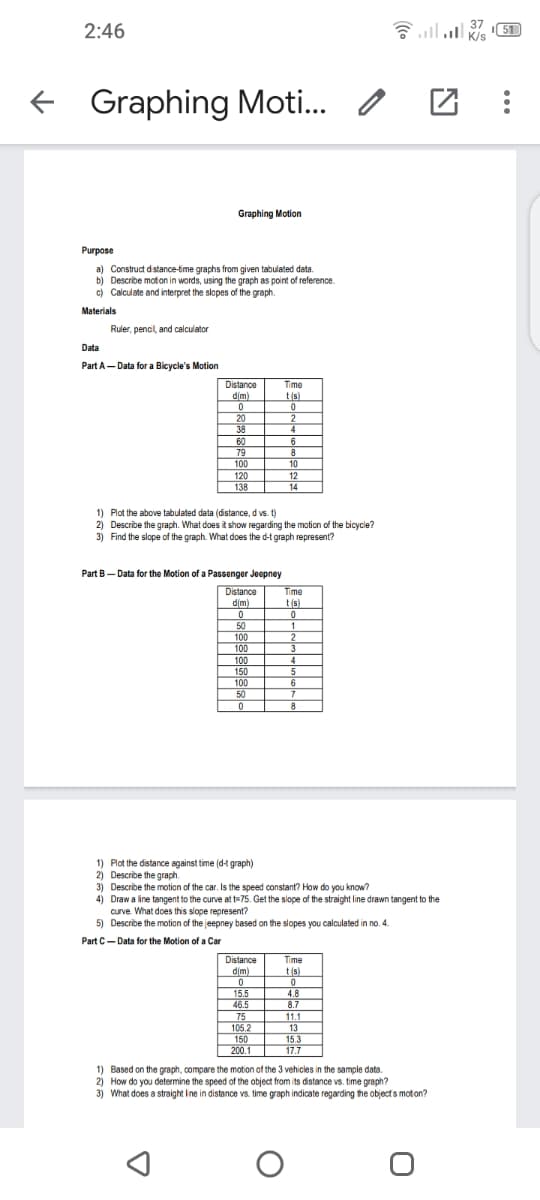
Graphing Motion Purpose a) Construct d stance-ime graphs from given tabulated data. b) Describe moton in words, using the graph as point of reference. o) Calculate and interpret the slopes of the graph. Materials Ruler, penci, and calculator Data Part A- Data for a Bicycle's Motion Distance Time dim) tis) 20 38 60 79 100 120 138 10 12 14 1) Plot the above tabulated data (distance, d vs. t) 2) Describe the graph. What does it show regarding the motion of the bicycle? 3) Find the slope of the graph. What does the d-t graph represent? Part B- Data for the Motion of a Passanger Joepney Distance dim) Time t(s) 50 100 100 100 150 100 50 1) Plot the distance against time (d-t graph) 2) Describe the graph. 3) Describe the motion of the car. Is the speed constant? How do you know? 4) Draw a line tangent to the curve at t75. Get the slope of the straight line drawn tangent to the curve. What does this slope represent? 5) Describe the motion of the jeepney based on the slopes you calculated in no. 4. Part C-Data for the Motion of a Car Distance dim) Time t(s) 15.5 46.5 75 105.2 150 200.1 4.8 8.7 11.1 13 15.3 17.7 1) Based on the graph, compare the motion of the 3 vehicles in the sample data. 2) How do you determine the speed of the object from its distance vs. time graph? 3) What does a straight Ine in distance vs. time graph indicate regarding the object s moton?

Inquiry into Physics
8th Edition
ISBN:9781337515863
Author:Ostdiek
Publisher:Ostdiek
Chapter1: The Study Of Motion
Section: Chapter Questions
Problem 15Q
icon
Related questions
icon
Concept explainers
Topic Video
Question
Answer part C
2:46
51
K/s
Graphing Moti.. o
Graphing Motion
Purpose
a) Construct d stance-time graphs from given tabulated data.
b) Describe moton in words, using the graph as point of reference.
c) Calculate and interpret the slopes of the graph.
Materials
Ruler, pencil, and calculator
Data
Part A- Data for a Bicycle's Motion
Distance
Time
dim)
t(s)
20
38
2
6
60
79
100
120
138
10
12
14
1) Plot the above tabulated data (distance, d vs. t)
2) Describe the graph. What does it show regarding the motion of the bicycle?
3) Find the slope of the graph. What does the d-t graph represent?
Part B-Data for the Motion of a Passenger Jeepney
Time
Distance
dịm)
t(s)
50
100
1.
100
3
100
150
4
100
50
6
8
1) Plot the distance against time (d-t graph)
2) Describe the graph.
3) Describe the motion of the car. Is the speed constant? How do you know?
4) Draw a line tangent to the curve at t=75. Get the slope of the straight line drawn tangent to the
curve. What does this slope represent?
5) Describe the motion of the jeepney based on the slopes you calculated in no. 4.
Part C- Data for the Motion of a Car
Distance
dim)
Time
t(s)
4.8
8.7
15.5
46.5
75
105.2
150
200.1
11.1
13
15.3
17.7
1) Based on the graph, compare the motion of the 3 vehicles in the sample data
2) How do you determine the speed of the object from its distance vs. time graph?
3) What does a straight Ine in distance vs. time graph indicate regarding the objects moton?
Transcribed Image Text:2:46 51 K/s Graphing Moti.. o Graphing Motion Purpose a) Construct d stance-time graphs from given tabulated data. b) Describe moton in words, using the graph as point of reference. c) Calculate and interpret the slopes of the graph. Materials Ruler, pencil, and calculator Data Part A- Data for a Bicycle's Motion Distance Time dim) t(s) 20 38 2 6 60 79 100 120 138 10 12 14 1) Plot the above tabulated data (distance, d vs. t) 2) Describe the graph. What does it show regarding the motion of the bicycle? 3) Find the slope of the graph. What does the d-t graph represent? Part B-Data for the Motion of a Passenger Jeepney Time Distance dịm) t(s) 50 100 1. 100 3 100 150 4 100 50 6 8 1) Plot the distance against time (d-t graph) 2) Describe the graph. 3) Describe the motion of the car. Is the speed constant? How do you know? 4) Draw a line tangent to the curve at t=75. Get the slope of the straight line drawn tangent to the curve. What does this slope represent? 5) Describe the motion of the jeepney based on the slopes you calculated in no. 4. Part C- Data for the Motion of a Car Distance dim) Time t(s) 4.8 8.7 15.5 46.5 75 105.2 150 200.1 11.1 13 15.3 17.7 1) Based on the graph, compare the motion of the 3 vehicles in the sample data 2) How do you determine the speed of the object from its distance vs. time graph? 3) What does a straight Ine in distance vs. time graph indicate regarding the objects moton?
Expert Solution
trending now

Trending now

This is a popular solution!

steps

Step by step

Solved in 3 steps with 1 images

Blurred answer
Knowledge Booster
Displacement, velocity and acceleration
Learn more about
Need a deep-dive on the concept behind this application? Look no further. Learn more about this topic, physics and related others by exploring similar questions and additional content below.
Similar questions
  • SEE MORE QUESTIONS
Recommended textbooks for you
Inquiry into Physics
Physics
ISBN:
9781337515863
Author:
Ostdiek
Publisher:
Cengage
College Physics
College Physics
Physics
ISBN:
9781938168000
Author:
Paul Peter Urone, Roger Hinrichs
Publisher:
OpenStax College
University Physics Volume 1
Physics
ISBN:
9781938168277
Author:
William Moebs, Samuel J. Ling, Jeff Sanny
Publisher:
OpenStax - Rice University
Glencoe Physics: Principles and Problems, Student…
Physics
ISBN:
9780078807213
Author:
Paul W. Zitzewitz
Publisher:
Glencoe/McGraw-Hill
College Physics
College Physics
Physics
ISBN:
9781285737027
Author:
Raymond A. Serway, Chris Vuille
Publisher:
Cengage Learning
College Physics
College Physics
Physics
ISBN:
9781305952300
Author:
Raymond A. Serway, Chris Vuille
Publisher:
Cengage Learning