GRAPHS Creating graphs with Excel (or a similar program) is preferred. Plot absorbance (y-axis) vs. λ (x- axis) for the absorbance curve determined in part 2. Connect the points with a smooth curve. Plot absorbance (y-axis) vs. concentration (x-axis) for the Beer's Law data from part 3. Draw a best-fit line or use a program such as Excel and do a least-squares fit to determine the best-fit line through the points. Attach your graphs to the yellow copies of your report from your notebook. CALCULATIONS Show a sample calculation of the concentration of the solutions made by dilution. Also use the slope of the best-fit line from your absorbance vs. concentration plot to calculate the concentration of Allura Red in each unknown. RESULTS Unknown # [Allura Red], M
GRAPHS Creating graphs with Excel (or a similar program) is preferred. Plot absorbance (y-axis) vs. λ (x- axis) for the absorbance curve determined in part 2. Connect the points with a smooth curve. Plot absorbance (y-axis) vs. concentration (x-axis) for the Beer's Law data from part 3. Draw a best-fit line or use a program such as Excel and do a least-squares fit to determine the best-fit line through the points. Attach your graphs to the yellow copies of your report from your notebook. CALCULATIONS Show a sample calculation of the concentration of the solutions made by dilution. Also use the slope of the best-fit line from your absorbance vs. concentration plot to calculate the concentration of Allura Red in each unknown. RESULTS Unknown # [Allura Red], M

Chapter25: Instruments For Optical Spectrometry
Section: Chapter Questions
Problem 25.12QAP

Related questions

Question
please please answer super super fast i really need it its very urgent and important please answer everything i need it before the end of today before 11:59pm I would really appreciate it if you would answer fast
![GRAPHS
Creating graphs with Excel (or a similar program) is preferred. Plot absorbance (y-axis) vs. λ (x-
axis) for the absorbance curve determined in part 2. Connect the points with a smooth curve.
Plot absorbance (y-axis) vs. concentration (x-axis) for the Beer's Law data from part 3. Draw a
best-fit line or use a program such as Excel and do a least-squares fit to determine the best-fit
line through the points. Attach your graphs to the yellow copies of your report from your
notebook.
CALCULATIONS
Show a sample calculation of the concentration of the solutions made by dilution. Also use the
slope of the best-fit line from your absorbance vs. concentration plot to calculate the
concentration of Allura Red in each unknown.
RESULTS
Unknown #
[Allura Red], M](/v2/_next/image?url=https%3A%2F%2Fcontent.bartleby.com%2Fqna-images%2Fquestion%2Fa833a647-b9ad-4697-b42a-39aaf6365497%2F57d9b7a7-4c9a-4374-bb45-9b81d641738d%2F7sysprq_processed.png&w=3840&q=75)
Transcribed Image Text:GRAPHS
Creating graphs with Excel (or a similar program) is preferred. Plot absorbance (y-axis) vs. λ (x-
axis) for the absorbance curve determined in part 2. Connect the points with a smooth curve.
Plot absorbance (y-axis) vs. concentration (x-axis) for the Beer's Law data from part 3. Draw a
best-fit line or use a program such as Excel and do a least-squares fit to determine the best-fit
line through the points. Attach your graphs to the yellow copies of your report from your
notebook.
CALCULATIONS
Show a sample calculation of the concentration of the solutions made by dilution. Also use the
slope of the best-fit line from your absorbance vs. concentration plot to calculate the
concentration of Allura Red in each unknown.
RESULTS
Unknown #
[Allura Red], M
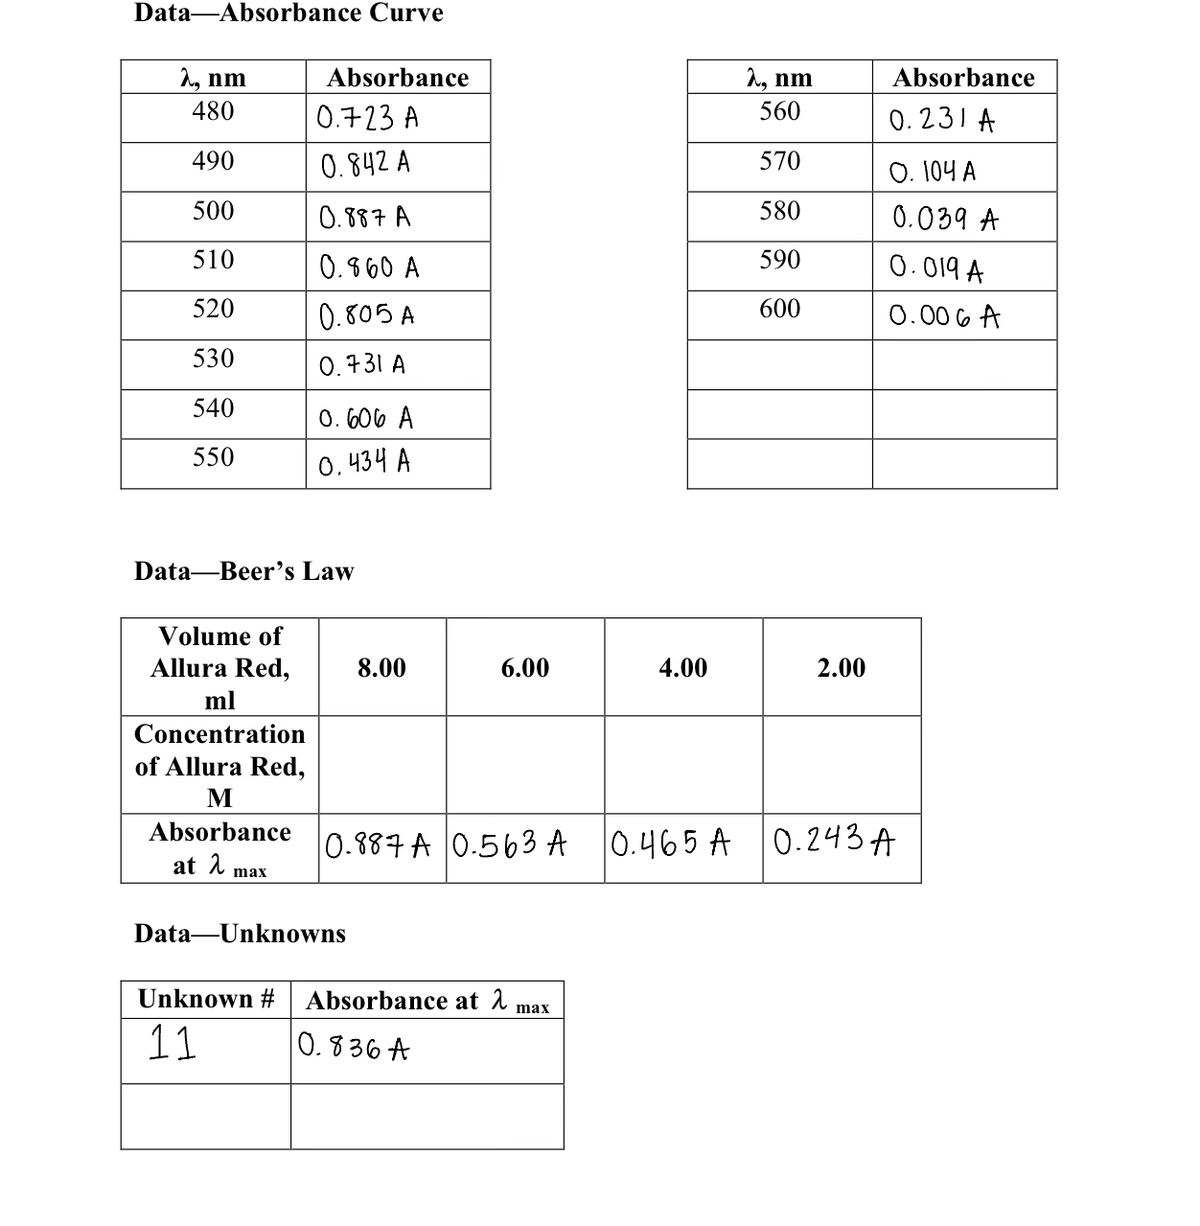
Transcribed Image Text:Data-Absorbance Curve
λ, nm
480
490
500
510
520
530
540
550
Volume of
Allura Red,
Data Beer's Law
ml
Concentration
of Allura Red,
M
Absorbance
at λ
Absorbance
0.723 A
0.842 A
0.887 A
0.860 A
0.805 A
0.731 A
max
0.606 A
0.434 A
8.00
Data-Unknowns
6.00
0.887 A 0.563 A
Unknown # Absorbance at λ max
11
0.836 A
4.00
2, nm
560
570
580
590
600
2.00
Absorbance
0.231 A
O. 104 A
0.039 A
0.019 A
0.006 A
0.465 A 0.243A
Expert Solution
This question has been solved!
Explore an expertly crafted, step-by-step solution for a thorough understanding of key concepts.

Step by step
Solved in 4 steps with 2 images

Knowledge Booster


Learn more about
Need a deep-dive on the concept behind this application? Look no further. Learn more about this topic, chemistry and related others by exploring similar questions and additional content below.Recommended textbooks for you

Principles of Instrumental Analysis
Chemistry
ISBN:
9781305577213
Author:
Douglas A. Skoog, F. James Holler, Stanley R. Crouch
Publisher:
Cengage Learning

Organic Chemistry
Chemistry
ISBN:
9781305580350
Author:
William H. Brown, Brent L. Iverson, Eric Anslyn, Christopher S. Foote
Publisher:
Cengage Learning
Principles of Instrumental Analysis
Chemistry
ISBN:
9781305577213
Author:
Douglas A. Skoog, F. James Holler, Stanley R. Crouch
Publisher:
Cengage Learning
Organic Chemistry
Chemistry
ISBN:
9781305580350
Author:
William H. Brown, Brent L. Iverson, Eric Anslyn, Christopher S. Foote
Publisher:
Cengage Learning