Grundig Technologies Balance Sheet (As of December 31, 2011) ASSETS 2011 2010 S 69,000 $82,000 $ 22,000 S6,000 Cash Accounts Receivable Supplies $15,000 $180,000 $75,000 $19,000 $189,000 $110,000 Inventories Land Equipment Accumulated Depreciation $260,000 $200,000 (69,000) (42,000) TOTAL ASSETS $612,000 $564,000 LIABILITIES S 34,000 $ 47,000 $19,000 $200,000 Accounts Payable Unearned Rent $15,000 $150,000 Bonds Payable Stockholders' Equity Common Stock($1 Par Value) Retained Earnings $214,000 199,000 $164,000 134,000 TOTAL LIABILITIES AND EQUITY $612,000 $564,000 Grundig Technologies Income Statement For the year ended December 31, 2011 Şales $560.000
Grundig Technologies Balance Sheet (As of December 31, 2011) ASSETS 2011 2010 S 69,000 $82,000 $ 22,000 S6,000 Cash Accounts Receivable Supplies $15,000 $180,000 $75,000 $19,000 $189,000 $110,000 Inventories Land Equipment Accumulated Depreciation $260,000 $200,000 (69,000) (42,000) TOTAL ASSETS $612,000 $564,000 LIABILITIES S 34,000 $ 47,000 $19,000 $200,000 Accounts Payable Unearned Rent $15,000 $150,000 Bonds Payable Stockholders' Equity Common Stock($1 Par Value) Retained Earnings $214,000 199,000 $164,000 134,000 TOTAL LIABILITIES AND EQUITY $612,000 $564,000 Grundig Technologies Income Statement For the year ended December 31, 2011 Şales $560.000

Survey of Accounting (Accounting I)
8th Edition
ISBN:9781305961883
Author:Carl Warren
Publisher:Carl Warren
Chapter9: Metric-analysis Of Financial Statements
Section: Chapter Questions
Problem 9.4.13P: Twenty metrics of liquidity, solvency, and profitability The comparative financial statements of...

Related questions
Question
- Calculate the Rate of
Return on Assets (ROA) for 2011. Disaggregate ROA into the profit margin for ROA and total assets turnover components. - Calculate the Rate of Return on Common
Stockholders’ Equity (ROCE) for 2011. Disaggregate ROCE into the profit margin for ROCE, total assets turnover and capital structure leverage components.
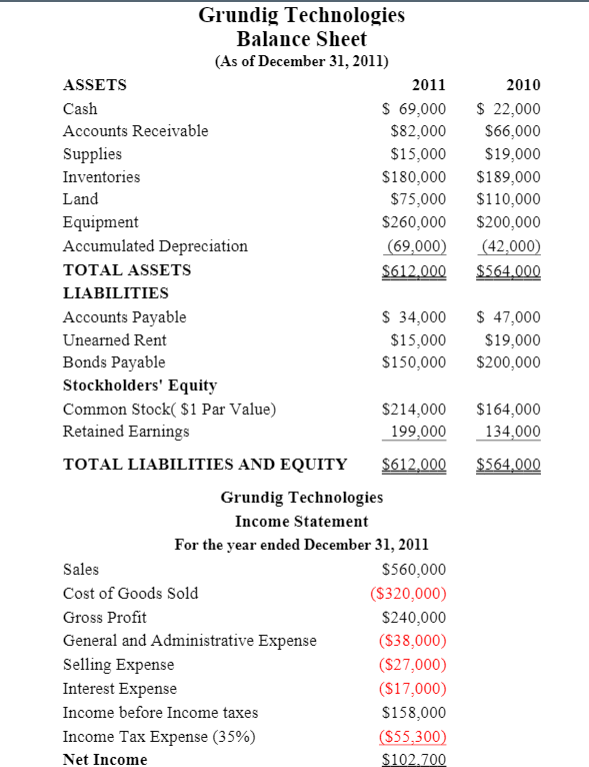
Transcribed Image Text:Grundig Technologies
Balance Sheet
(As of December 31, 2011)
ASSETS
2011
2010
Cash
S 69,000
$ 22,000
Accounts Receivable
$82,000
S66,000
Supplies
$15,000
$19,000
Inventories
$189,000
$110,000
$200,000
$180,000
Land
$75,000
Equipment
Accumulated Depreciation
$260,000
(69,000)
(42,000)
TOTAL ASSETS
$612.000
$564,000
LIABILITIES
Accounts Payable
$ 34,000
$ 47,000
Unearned Rent
$15,000
$150,000
$19,000
$200,000
Bonds Payable
Stockholders' Equity
Common Stock( $1 Par Value)
Retained Earnings
$164,000
134,000
$214,000
199,000
TOTAL LIABILITIES AND EQUITY
$612,000
$564,000
Grundig Technologies
Income Statement
For the year ended December 31, 201i
Sales
$560,000
Cost of Goods Sold
($320,000)
Gross Profit
$240,000
General and Administrative Expense
Selling Expense
Interest Expense
($38,000)
($27,000)
(S17,000)
Income before Income taxes
$158,000
Income Tax Expense (35%)
(S55,300)
Net Income
$102.700
Expert Solution
This question has been solved!
Explore an expertly crafted, step-by-step solution for a thorough understanding of key concepts.

This is a popular solution!

Trending now
This is a popular solution!

Step by step
Solved in 3 steps

Knowledge Booster


Learn more about
Need a deep-dive on the concept behind this application? Look no further. Learn more about this topic, finance and related others by exploring similar questions and additional content below.Recommended textbooks for you
Survey of Accounting (Accounting I)
Accounting
ISBN:
9781305961883
Author:
Carl Warren
Publisher:
Cengage Learning

Survey of Accounting (Accounting I)
Accounting
ISBN:
9781305961883
Author:
Carl Warren
Publisher:
Cengage Learning