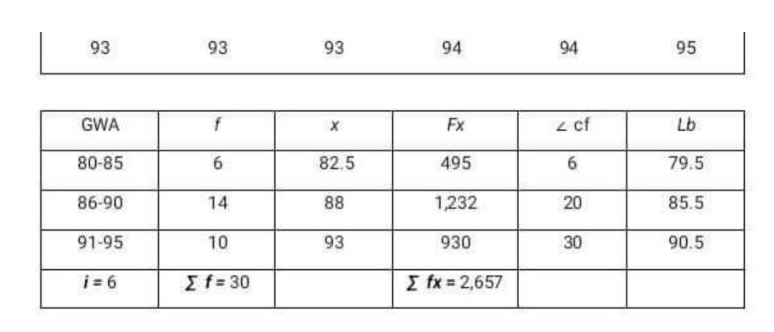
GWA 80-85 86-90 91-95 i=6 f 6 14 10 Σf=30 X 82.5 88 93 FX 495 1,232 930 Σ fx = 2,657 2 cf 6 20 30 Lb 79.5 85.5 90.5


Q: 24. People with an autoimmune disease like lupus produce antibodies that react to their own tissues.…
A: Since you have posted a question with multiple sub-parts, we will solve the first three sub-parts…
Q: Are freshmen psychology majors more likely to change their major before they graduate compared to…
A: Given X1=370 n1=674 X2=296 n2=616
Q: A school principal claims that the number of students who are tardy to school does not vary from…
A:
Q: Calculate the sample mean and sample variance for the following frequency distribution of heights in…
A:
Q: Eight thousand raffle tickets are sold. One first prize of $1000, two second prizes of $500, and…
A: 1st prize $1000 2nd prize $500 3rd prize $100
Q: 3. Let the universal set U be the set of all students at Oklahoma State University. Let C be the set…
A: Given that Let U be the universal set C be the set of students who at least one cat. D be the set…
Q: The table below gives the list price and the number of bids received for five randomly selected…
A: The slope of the regression equation can be obtained by performing a regression analysis on the…
Q: 11. Yellow M&Ms Express the confidence interval (0.0169, 0.143) in the form of p-E <p < p + E.
A: It is given that the confidence interval of Yellow M&Ms.
Q: 31. Lefties Find the sample size needed to estimate the percentage of California residents who are…
A: From the provided information, Confidence level = 99% Margin of error = 0.03
Q: Step 2 of 4 : Calculate the expected value for the number of swimmers on Tuesday. Enter your…
A: Given that Monday Tuesday Wednesday Thursday Friday Number 64 46 41 56 70
Q: need help with this question.
A: red : 1 to 8 blue : 1 to 10 total 18 marbles draw a marble at random.
Q: Large samples of women and men are obtained, and the hemoglobin level is measured in each subject.…
A:
Q: A college entrance exam company determined that a score of 22 on the mathematics portion of the exam…
A:
Q: Researchers studying pleasant touch sensations measured the firing frequency (impulses per second)…
A:
Q: A student was asked to find a 98% confidence interval for widget width using data from a random…
A: Given confidence interval is 14<μ<25.1sample size(n)=18
Q: Suppose that the duration of a particular type of criminal trial is known to be normally distributed…
A:
Q: Pizza Ple 'N Go sells about 1600 one-topping pizzas each month. The ple chart displays the most…
A: Here we have given the information, Pizza pie 'N Go sells about 1600 one-topping pizzas each month.…
Q: A poll was conducted to investigate opinions about global warming. The respondents who answered yes…
A: The data shows the gender and their choice for the cause of global warming.
Q: ) In a survey of 1223 U.S. adults, 474 said that they were very confident in the nutritional…
A: As per bartleby guidelines we can solve only first question and 3 subparts if any Nd rest can be…
Q: Residents of certain regions were asked about their thoughts on national defense spending. The…
A: Obtain the empirical probability that an individual desires decreased defense spending, given that…
Q: show the formulas on how to get the anova: single factors just like show in the pictures ... tysm <3
A: Introduction Anova is used for comparison of more than 2 means.
Q: SAT exam scores are normally distributed with μ = 500 and σ = 100. Use your calculator to find the…
A: We have given that Mean(µ) = 500Standard deviations (σ) = 100X ~ N (µ, σ )= N(500, 100)
Q: a) Show that k = 1/21 (b) Find P(X ≤2). (c) Find P(X = 2). (d) Find E(X),E(X2) and Var(X)
A: Given,f(x)={kx2;1≤x≤40; otherwise
Q: The pie chart shows the amount of time each day that Gary spends on various activities. If this…
A: The pie chart for the amount of time each day Person G spends of various activities is given.
Q: Propose mthe most suitable statistical test to reseach the following hypothesis.
A: To identify the most suitable statistical test for the given hypothesis.
Q: It has been claimed that at UCLA 43% of all students live on campus. Researcher Ebony Robinson…
A: Given X=112 n=250
Q: (a) Formulate the log-likelihood function. (b) Find the ML estimator of o². (c) Derive the variance…
A: As per bartleby guidelines we can solve only first three subparts and rest can be reposted
Q: The amount of coffee that people drink per day is normally distributed with a mean of 17 ounces and…
A: given data, normal distrubutionμ=17σ=5n=8we have to answer for the given data.
Q: A sample of 321 urban adult residents of a particular state revealed 39 who favored increasing the…
A: Given:- First sample, X1 = 59 n1 = 321, p1 = X1 / n1 =0.184 Second sample, X2 =77, n2 =…
Q: The function I (t) = - 0.2t3 + 3t2 +100 for 0 ≤ t ≤ 9 gives the CPI of an economy, where t = 0…
A: Regression equation is used to predict the variable based on the explanatory variable. It explain…
Q: e @RISK to draw a triangular distribution with parameters 200, 300, and 600. Then superimpose a…
A: The triangular distribution is a continuous distribution. The distribution takes 3 parameters :…
Q: chi-square distribution because the parameter is o or o², and the mo Student's t-distribution…
A: Given, population mean ( µ ) = 100 sample size (n) = 20 sample mean (x̄) = 104.3 sample standard…
Q: Suppose that you are to conduct the following hypothesis test: Ho: μ = 530 H: μ # 530 Assume that…
A: Given Population mean μ=530, standard deviations σ=95, n=50, sample mean x̄=510.05, level of…
Q: Would the skewness K3 and kurtosis K4 of the 100 observations shown in the following histogram both…
A: From the given histogram of 100 observations, we have to determine whether the values of K3 and K4…
Q: costs and improve profits, any US companies have been turning to ou rcing. In fact, according to…
A: Solution: Given information: n= 555 Sample size p= 0.54 Population proportion.
Q: Cached Pivot Table data provides automatic data updating. O True False
A: Solution-: Cached Pivot table data provides automatic data updating. (a) True (b) False
Q: A population of values has a normal distribution with μ = 39.4 and σ = 52.5. a. Find the probability…
A: From the provided information, Mean (µ) = 39.4 Standard deviation (σ) = 52.5 X~N (39.4, 52.5)
Q: University students were asked if they agreed that their education was worth the cost. One variable…
A: Given that: X Y 28 52 29 58 30 61 37 54 45 53 47 61 52 54 54 62 57 69 60 58…
Q: Find the sample size necessary to estimate the mean arrival delay time for all American Airlines…
A: Given,margin of error(E)=5population standard deviation(σ)=36.6
Q: Consider the following sets of sample data: A: 145, 126, 120, 97, 123, 119, 115, 96, 134, 125, 96,…
A: It is needed to find the spread of the data sets.
Q: Does how long young children remain at the lunch table help predict how much they eat? Twenty…
A: From the provided information, The regression equation is as follow: y^=178+2.7x Here x is the…
Q: The article "The Undrained Strength of Some Thawed Permafrost Soils"+ contained the accompanying…
A: Given that: y x1 x2 predicted y residual 14.7 8.8 31.4 23.41 -8.71 48 36.5 26.9 46.39 1.61…
Q: Consider the following data on y = number of songs stored on an MP3 player and x = number of months…
A: Given data: x y 24 485 34 746 2 81 28 581 5 117 32 728 23 445 10 128 4 61 26…
Q: Answer the following questions on the F test statistic. Complete parts (a) through (d) below. 2 a.…
A: a. The sample variance for 1st sample is s12.
Q: 71% of all students at a college still need to take another math class. If 5 students are randomly…
A: Solution: Given that, 71% of all students at a college still need to take another math class p=0.71…
Q: What is the measurement of explained variation? Coefficient of multiple determination Coefficient…
A: The coefficient of determination is the percentage of variation explained by the independent…
Q: Test the given claim. Assume that a simple random sample is selected from a normally distributed…
A: The given claim is that the new product method has error with a standard deviation greater than…
Q: Fill in the table below: Find : Find S Find Sy: x Find r: 4 5 сл 3 لیا 7 12 2 x 0 18 y y 5 сл Find…
A: Given data is x y 4 7 5 12 3 2
Q: 1. Explain each of the four slopes (Period, Q1, Q2, Q3). 2. How many new customers would you…
A: The problem is about Multiple Linear Regression.
Q: To test Ho: μ = 100 versus H₁: μ# 100, a simple random sample size of n = 16 is obtained from a…
A: From the provided information, Sample size (n) = 16 Sample mean (x̄) = 104.4 Sample standard…
solve for the mean median
show complete solutions manually

Step by step
Solved in 2 steps with 1 images

- Repeat Example 5 when microphone A receives the sound 4 seconds before microphone B.how do you find z sub alpha over 2 using table a-2It might be predicted that consumer buying behavior would vary with the location of products in a store. Therefore, a team of market researchers looked at the sales per day for a known and unknown brand of candy bars. Additionally, the researchers placed the candy bars in the usual location and next to the cash register in different stores. What can the market researchers conclude with an α of 0.01? known brand known brand unknown brand unknown brand usual register usual register 1624191773018 25151620312719 11691314711 19181621221719 A) Obtain/compute the appropriate values to make a decision about H0. Location: critical value = test statistic = Decision: Brand: critical value = test statistic = Decision: Interaction: critical value = test statistic = Decision: B) Compute the corresponding effect size(s) and indicate magnitude(s).Location: η2 = Brand: η2 = Interaction: η2 = C) Make an interpretation based on the results.…
- To increase egg production, a farmer decided to increase the number of times the lights in his henhouse were on. Ten hens were randomly selected, and the number of eggs each produced was recorded. After one week of lengthened light time, the same hens were monitored again. The data is given here. At α = 0.05, can it be concluded that the increased light time increased egg production? Hen 1 2 3 4 5 6 7 8 9 10 Before 4 3 8 7 6 4 9 7 6 5 After 6 5 9 7 4 5 10 6 9 6I submitted this question for a),b), c),d),e) & f) in 2 parts already. Since I can only submit 3 parts at a time I am only looking for the answer to g) in this submission. Thank you A professor at a large university assigns a project to his class because he is interested to discover what proportion of students at the university are willing to report cheating by other students. One group posed this question to an SRS of 189 undergraduate students, "You witness two students cheating on a quiz. Do you go to the professor?" Only 22 answered "Yes." a) Identify the point estimator you would use. b) Calculate the value of the point estimate. c) Identify the population and parameter of interest. d) Identify each of the conditions that must be met to use this procedure and explain how you know that each one has been satisfied. e) Find the label the appropriate critical value and the standard error for a 90% confidence interval. Show your methods and label clearly. f) Calculate the 90%…Show the complete derivitation of the following: 1. Beta Functions 2. Gamma Functions
- Find ln(9.2) from ln(9.0) = 2.1972 and ln(9.5) = 2.2513 by linear interpolation and get the %error.Forel Series connection and signals are required, my T=12Two neurologists, Drs. J and K, independently examined 70 magnetic resonance images (MRIs) for evidence of brain tumors. As shown in the table below, the neurologists read each MRI as either “positive” or “negative” for brain tumors. Dr J Dr K Positive Negative Positive 26 12 Negative 14 18 Based on the above information, the kappa estimate for the reliability of the two doctors' results is: [Present your answer as a decimal fraction (two digits after the decimal point, round if needed). Example: 0.01]
- An SRS of 100 flights by Speedy Airlines showed that 64 were on time. An SRS of 100 flights by Happy Airlines showed that 80 were on time. Let pS be the proportion of on-time flights for all Speedy Airline flights, and let pH be the proportion of all on-time flights for all Happy Airlines flights. Is there evidence of a difference in the on-time rate for the two airlines? To determine this, you test the hypotheses H0 : pS – pH 0, Ha : pS – pH 0. The P-value of your test is 0.0117. Which of the following is an appropriate interpretation of the P-value? a. If the on-time rates for the two airlines are equal, there is a 0.0117 probability of getting samples with a difference as far or farther from zero as these samples. b. If the on-time rates for the two airlines are not equal, the probability of getting samples with a difference as far or farther from zero as these samples is 0.9883. c. The probability of making a Type I error is 0.0117. d. The probability of making a Type II error…4) Use Table E.3 on pp.666-667 to answer to four decimal places. Find -ta,n-1, if n = 21, a= 0.005. -t0.005,20 = 7) Use Table E.3 on pp.666-667 to answer to four decimal places. Find ta/2,n-1, if n = 25, a = 0.01. t0.005,24Which one is correct? Consider the Cobb- Douglas production function, Q = aK^bL^c ; b and ca) Can be estimated using OLS on the equation Q = a +bK+cL b) Can be calculated from the covariances of K and L with Qc) cannot be estimated using OLS d) can be estimated using OLS on the equation log(Q) =log(a) +b log(K) +b log(L)
