show the formulas on how to get the anova: single factors just like show in the pictures ... tysm <3
show the formulas on how to get the anova: single factors just like show in the pictures ... tysm <3

MATLAB: An Introduction with Applications
6th Edition
ISBN:9781119256830
Author:Amos Gilat
Publisher:Amos Gilat
Chapter1: Starting With Matlab
Section: Chapter Questions
Problem 1P

Related questions
Question
100%
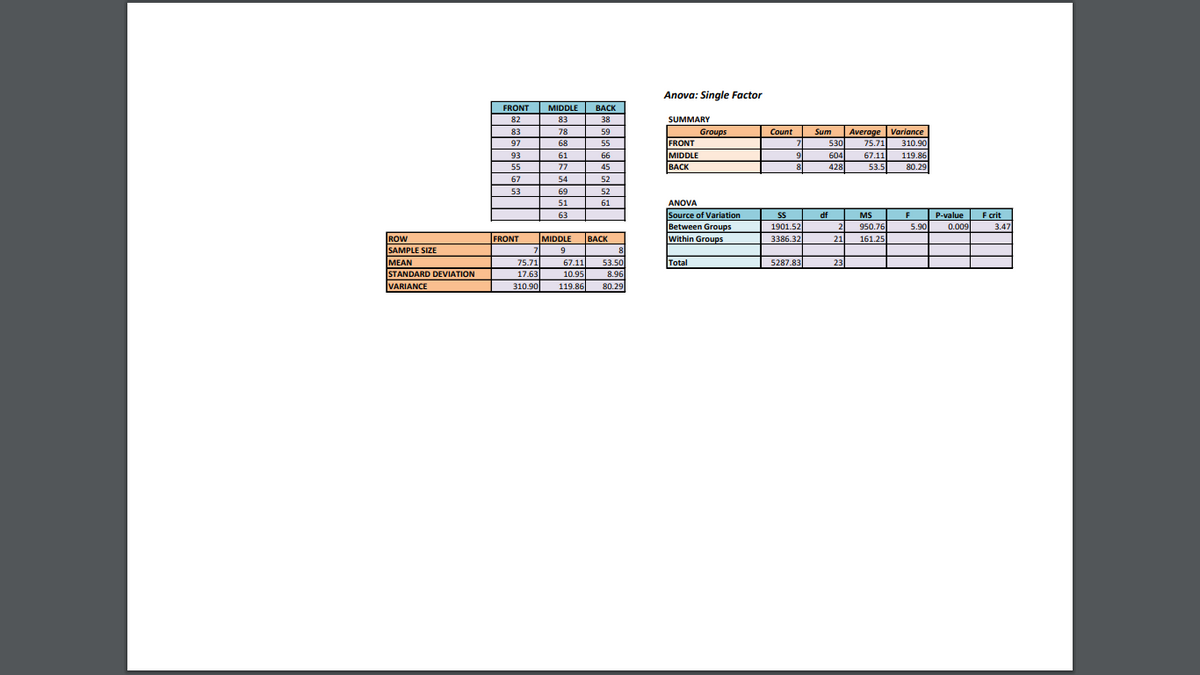
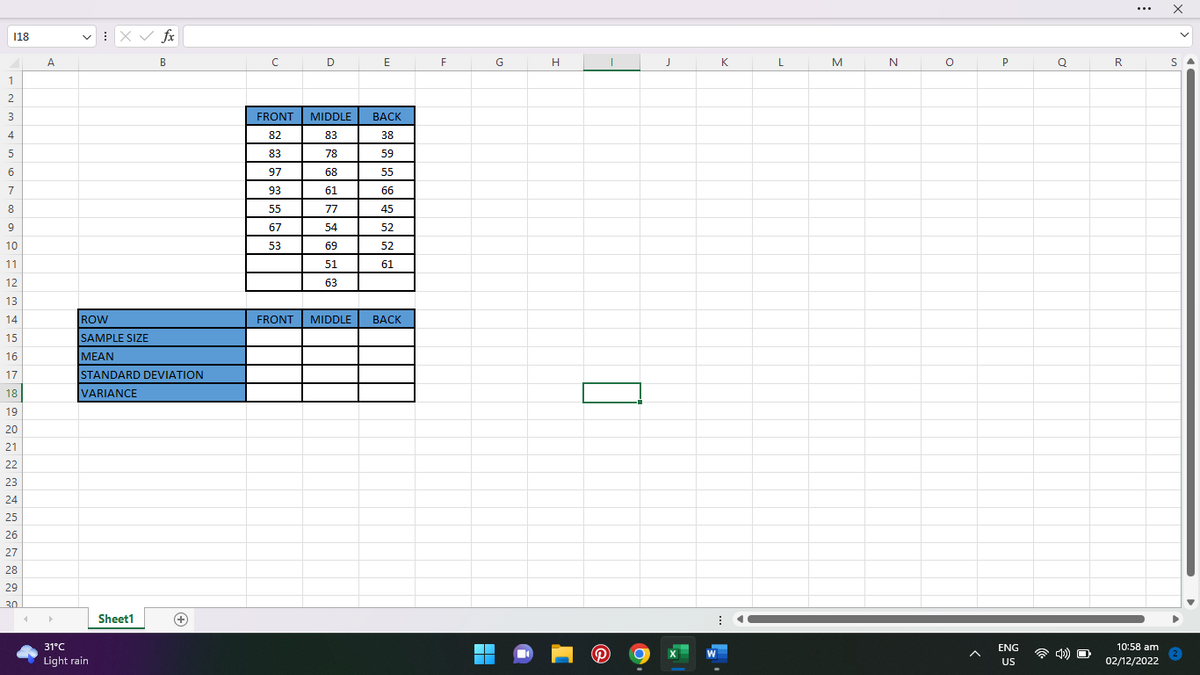
show the formulas on how to get the anova: single factors just like show in the pictures ... tysm <3
Transcribed Image Text:ROW
SAMPLE SIZE
MEAN
STANDARD DEVIATION
VARIANCE
FRONT
82
83
97
93
55
67
53
FRONT
7
75.71
17.63
310.90
MIDDLE
83
78
68
61
77
54
69
51
63
BACK
38
59
55
66
45
52
52
61
MIDDLE BACK
9
8
67.11 53.50
10.95
8.96
80.29
119.86
Anova: Single Factor
SUMMARY
FRONT
MIDDLE
BACK
Groups
ANOVA
Source of Variation
Between Groups
Within Groups
Total
Count
7
9
8
SS
1901.52
3386.32
5287.83
Sum Average Variance
530 75.71 310.90
604
428
67.11 119.86
53.5 80.29
df
2
21
23
MS
950.76
161.25
F
5.90
P-value
0.009
F crit
3.47
Transcribed Image Text:118
1
2
3
4
5
6
7
8
9
10
11
12
13
14
15
16
17
18
19
20
21
22
23
24
25
26
27
28
29
30
A
X✓ fx
B
ROW
SAMPLE SIZE
MEAN
STANDARD DEVIATION
VARIANCE
31°C
Light rain
Sheet1
+
с
FRONT
82
83
97
93
55
67
53
D
MIDDLE
83
78
68
61
77
54
69
51
63
FRONT MIDDLE
E
BACK
38
59
55
66
45
52
52
61
BACK
F
■
[
H
I
J
K
L
M
N
O
P
ENG
US
Q
4) O
R
...
10:58 am
02/12/2022
X
SA
Expert Solution
This question has been solved!
Explore an expertly crafted, step-by-step solution for a thorough understanding of key concepts.

Step by step
Solved in 2 steps with 5 images

Recommended textbooks for you
MATLAB: An Introduction with Applications
Statistics
ISBN:
9781119256830
Author:
Amos Gilat
Publisher:
John Wiley & Sons Inc

Probability and Statistics for Engineering and th…
Statistics
ISBN:
9781305251809
Author:
Jay L. Devore
Publisher:
Cengage Learning

Statistics for The Behavioral Sciences (MindTap C…
Statistics
ISBN:
9781305504912
Author:
Frederick J Gravetter, Larry B. Wallnau
Publisher:
Cengage Learning
MATLAB: An Introduction with Applications
Statistics
ISBN:
9781119256830
Author:
Amos Gilat
Publisher:
John Wiley & Sons Inc
Probability and Statistics for Engineering and th…
Statistics
ISBN:
9781305251809
Author:
Jay L. Devore
Publisher:
Cengage Learning
Statistics for The Behavioral Sciences (MindTap C…
Statistics
ISBN:
9781305504912
Author:
Frederick J Gravetter, Larry B. Wallnau
Publisher:
Cengage Learning

Elementary Statistics: Picturing the World (7th E…
Statistics
ISBN:
9780134683416
Author:
Ron Larson, Betsy Farber
Publisher:
PEARSON

The Basic Practice of Statistics
Statistics
ISBN:
9781319042578
Author:
David S. Moore, William I. Notz, Michael A. Fligner
Publisher:
W. H. Freeman

Introduction to the Practice of Statistics
Statistics
ISBN:
9781319013387
Author:
David S. Moore, George P. McCabe, Bruce A. Craig
Publisher:
W. H. Freeman