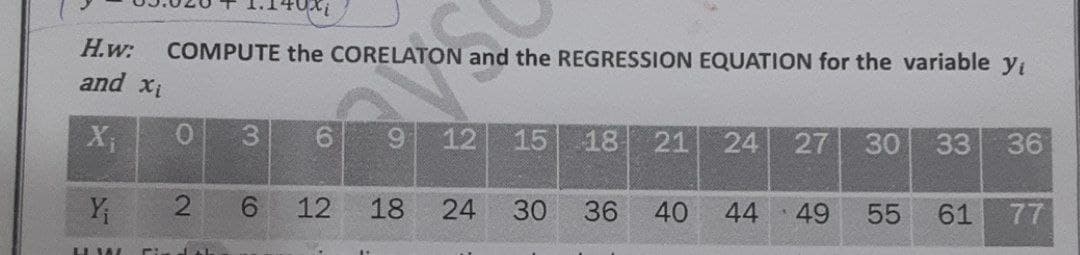
H.w: COMPUTE the CORELATON and the REGRESSION EQUATION for the variable yı and xi X 3 6. 15 18 21 24 27 30 33 36 Y 6. 12 18 24 30 36 40 44 49 55 61 77 12 2.
Q: Find the value of s in a simple linear regression model if SSE = 175 and n = 27. O 7 24 148 6.4
A: The variance is calculated ass2=SSEn-1
Q: Obtain the equations of the lines of regression of Y on X from the following data. X : 12 18 24 30…
A: Introduction: Consider that x is the independent variable and y is the dependent variable. The size…
Q: The number of initial public offerings of stock issued in a 10-year period and the total proceeds of…
A: Given Information:
Q: The number of initial public offerings of stock issued in a 10-year period and the total proceeds of…
A: Regression analysis
Q: Use the given data to find the equation of the regression line. Examine the scatterplot and identify…
A: Given First enter this data into Excel
Q: (b)A random sample of twelve students were chosen, and their midterm test score ( y), assignment…
A: i) From the given output, the multiple regression equation is, ˆy = 27.547+ 0.922x1 + 0.284x2 ii)…
Q: Use the gi ven data to find the equation of the regression line. Round the final values to three…
A:
Q: Use the given data to find the equation of the regression line. Examine the scatterplot and identify…
A: In simple linear regression there will be only one independent variable. In multiple linear…
Q: Based on the data shown below, calculate the regression line (each value to two decimal places) y =…
A: Regression Equation: When we want to predict the value of one variable, say y, from the given value…
Q: The number of initial public offerings of stock issued in a 10-year period and the total proceeds of…
A: (a). Given, n=10 The table below shows the required calculation: x y xy x2 y2 415 18867…
Q: Based on the data below, calculate the regression line(each value to at least two decimal places) X…
A:
Q: Find b0 and b1 and derive the regression line equation for the data below: x y 0 2 1 3 2 5 3 7 4 10…
A: From given data, X Y X*Y X*X 0 2 0 0 1 3 3 1 2 5 10 4 3 7 21 9 4 10 40 16…
Q: (b)A random sample of twelve students were chosen, and their midterm test score ( y), assignment…
A: Note: Since you have posted a question with multiple subparts, we will solve the first three…
Q: The table below shows the average temperature in New York City (NYC), measured in degrees Fahrenheit…
A:
Q: y 11 13 14 15 20 23 25 32 x1 2 4 4 8 7 12 15 19 x2 15 9 13 11 2 8 7 5 x3 F F F M M F M F a) using…
A: Excel command Data > Data analysis > Regression > select the data > ok SUMMARY…
Q: (b)A random sample of twelve students were chosen, and their midterm test score ( y), assignment…
A: b (i) Step-by-step procedure to find the regression equation using Excel: In Excel sheet, enter…
Q: Use least-square regression to fit a straight line to the given data below: x y 3 12.3 5 14.1 6 13.0…
A: We have to find the best fitted curve for straight line.
Q: A sales manager collected the following data on x = years of experience and y = annual sales…
A: Use EXCEL to obtain the values of SST, SSR and SSE. EXCEL procedure: Go to EXCEL Go to Data>Data…
Q: 14. Given the following data : 2 10 4 8 Y 9. 11 8 Find the two regression equations and calculate…
A:
Q: Based on the data shown below, calculate the regression line (each value to at least two decimal…
A: Enter the given data into the excel as follows:
Q: Use the given data to find the equation of the regression line. x 3 5 7 15 14 y 8 11 7 16 19
A: We want to fit regression line
Q: Eight pairs of data yield r = 0.708 and the regression equation v= 55.8+2.79x. Also, v=71125. What…
A: Linear regression is a linear approach to model the relationship between a dependent variable and…
Q: The number of initial public offerings of stock issued in a 10-year period and the total proceeds of…
A: a) Scatterplot for x and y: Procedure to draw scatter plot using Excel software is given below:…
Q: Consider the following data for a dependent variable y and two independent variables, x, and x2. X1…
A: a) Therefore, we find that the regression equation is: y^=45.1+1.9*x1 predict y^ if x1=51 we…
Q: The number of initial public offerings of stock issued in a 10-year period and the total proceeds of…
A: Obtain the value of the standard error of estimate. The value of the standard error of estimate…
Q: The number of initial public offerings of stock issued in a 10-year period and the total proceeds of…
A: The independent variable is Issues. The dependent variable is Proceeds. We have to find the…
Q: Give the following data: X 6 2 10 4 8 Y 9 11 5 8 7 Find the two regression equations and calculate…
A:
Q: The grades of a sample of 9 students on a prelim exam (x) and on the midterm exam (y) are shown…
A: Calculate Fitting a straight line - Curve fitting using Least square method X Y 96 99 81 47…
Q: Given are five observations for two variables, x and y. xi -3 12 6 20 14 yi -55 40 55 10 15 Develop…
A: Given that
Q: Use the given data to find the equation of the regression line. Examine the scatterplot and identify…
A: We have given,
Q: 1.) The table below is about the academic performance in Mathematics of 10 students. Make a simple…
A: The regression analysis is conducted here by using EXCEL. The software procedure is given below:…
Q: The number of initial public offerings of stock issued in a 10-year period and the total proceeds of…
A:
Q: The grades of a sample of 9 students on a prelim exam (x) and on the midterm exam (y) are shown…
A: Given that, The grades of a sample of 9 students on a prelim exam (x) and on the midterm exam (y)…
Q: Use the given data to find the equation of the regression line. Examine the scatterplot and identify…
A: Given: Sr. No. x y 1 5 6.86 2 4 5.09 3 6 8.31 4 7 9.47 5 3 3.02 6 12 10.69 7 9…
Q: y 96 99 81 47 71 78 72 34 50 66 94 85 77 82 99 99 67 68
A:
Q: A sample has 11 paired observations, Use the xas the independent variable and the y as the dependent…
A:
Q: The number of initial public offerings of stock issued in a 10-year period and the total proceeds of…
A: SOLUTION
Q: length,x 1 2 3 4 observed y 4.4 5 6.6 7 predicted y 4.34 5.28 6.22 7.16 calculate the regression…
A: There are many accuracy measures for a regression model to evaluate the performance of a model.…
Q: Use the given data to find the equation of the regression line. Examine the scatterplot and identify…
A: Given data, X Y X*Y X*X 13 11.54 150.02 169 11 12.06 132.66 121 7 8.86 62.02 49 10…
Q: Consider the following data for a dependent variable y and two independent variables, x, and x,. X1…
A: Since you have posted a question with multiple sub-parts, we will solve first three subparts for…
Q: Consider the following data for two variables, x and y. x 22 24 26 30 35 40 y 11 21 34 36 39 36…
A: From the given information, x y x^2 22 11 484 24 21 576 26 34 676 30 36 900 35 39 1225…
Q: Given are five observations for two variables, x and y. xi 3 12 6 20 14 yi 55 45 50 15 20 #1)…
A:
Q: The number of initial public offerings of stock issued in a 10-year period and the total proceeds of…
A: Regression analysis
Q: Consider the data. x, 12 3 45 y, 4 8 5 11 12 The estimated regression equation for these data is ŷ =…
A: The given data is x y 1 4 2 8 3 5 4 11 5 12
Q: The following sample contains the scores of 6 students selected at random in Mathematics and…
A: Given information ∑x=464, ∑y=476,∑x^2=36354,∑y^2=38254, ∑xy=36926.
Q: 4) The data below are the number of absences and the final grades of 9 randomly selected students…
A: Given data: Number of absences 0 3 6 4 9 2 15 8 5 Final grade 98 86 80 82 71 92 55 76 82
Q: The following table displays the mathematics test scores for a random sample of college students,…
A: Given data : Sr. No. Mathematics test(x) SY16C grades(y) 1 39 65 2 43 78 3 21…
Q: Find the multiple regression line Y on X, and X2 from the following data, 12 10 2 2 1 Y 9. 13 20 3 4…
A: Multiple linear regression is a regression model that estimates the relationship between a dependent…
Q: Use the given data to find the equation of the regression line. x 1.2 1.4 1.6 1.7 2.1 y 54 53 54 55…
A:
Q: (b)A random sample of twelve students were chosen, and their midterm test score ( y), assignment…
A: Given: y x1 x2 85 65 8 74 50 7 76 55 5 90 65 2 85 55 6 87 70 3 94 65 2 98 70 5…
Step by step
Solved in 3 steps with 2 images
- The following fictitious table shows kryptonite price, in dollar per gram, t years after 2006. t= Years since 2006 0 1 2 3 4 5 6 7 8 9 10 K= Price 56 51 50 55 58 52 45 43 44 48 51 Make a quartic model of these data. Round the regression parameters to two decimal places.Olympic Pole Vault The graph in Figure 7 indicates that in recent years the winning Olympic men’s pole vault height has fallen below the value predicted by the regression line in Example 2. This might have occurred because when the pole vault was a new event there was much room for improvement in vaulters’ performances, whereas now even the best training can produce only incremental advances. Let’s see whether concentrating on more recent results gives a better predictor of future records. (a) Use the data in Table 2 (page 176) to complete the table of winning pole vault heights shown in the margin. (Note that we are using x=0 to correspond to the year 1972, where this restricted data set begins.) (b) Find the regression line for the data in part ‚(a). (c) Plot the data and the regression line on the same axes. Does the regression line seem to provide a good model for the data? (d) What does the regression line predict as the winning pole vault height for the 2012 Olympics? Compare this predicted value to the actual 2012 winning height of 5.97 m, as described on page 177. Has this new regression line provided a better prediction than the line in Example 2?The marketing manager of a supermarket chain would like to determine the effect of shelf spaceon the sales of pet food. A random sample of 10 stores was selected, and the results are presentedbelow. Store shelf space in cm weekly sales in thousand pesos 1 45 18 2 45 21 3 75 15 4 80 18 5 95 23 6 100 26 7 135 22 8 140 27 9 185 25 10 190 28 d. Using the estimated simple linear regression equation Y=15.6414+0.0611X, estimate the weekly sales when theshelf space is 230cm? 250cm? e. Compute the coefficient of determination and interpret its value.