H.W(1) the data below represent workers' wages: 10 21 43 46 53 75 55 40 36 47 30 41 48 32 47 35 46 56 66 62 61 21 22 37 15 57 25 27 50 72 31 32 39 49 35 42 54 42 44 51 32 44 48 23 71 18 65 1. Create a frequency table. 2. Plot histogram, curve, relative curve and polygon 3. Plot Ascending and descending cumulative frequency. 4. Find the number of workers who have wages less than 35S. 5. Find the percentage of the number of workers who their wages ranging are between (25-55)S. 2347 52 63 45
H.W(1) the data below represent workers' wages: 10 21 43 46 53 75 55 40 36 47 30 41 48 32 47 35 46 56 66 62 61 21 22 37 15 57 25 27 50 72 31 32 39 49 35 42 54 42 44 51 32 44 48 23 71 18 65 1. Create a frequency table. 2. Plot histogram, curve, relative curve and polygon 3. Plot Ascending and descending cumulative frequency. 4. Find the number of workers who have wages less than 35S. 5. Find the percentage of the number of workers who their wages ranging are between (25-55)S. 2347 52 63 45

Glencoe Algebra 1, Student Edition, 9780079039897, 0079039898, 2018
18th Edition
ISBN:9780079039897
Author:Carter
Publisher:Carter
Chapter10: Statistics
Section10.6: Summarizing Categorical Data
Problem 4AGP

Related questions
Question
i need the answer quickly
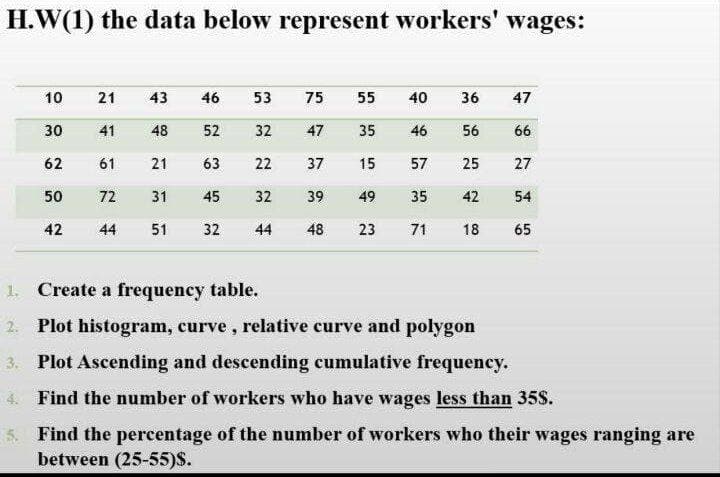
Transcribed Image Text:H.W(1) the data below represent workers' wages:
10
21
43
46
53
75
55
40 36 47
30
41
48
52
32
47
35
46 56
66
62
61
21 63 22
37
15
57
25 27
50
72
31
45
32
39
49
35
42
54
42
44 51
32 44
48 23
71
18
65
1. Create a frequency table.
2. Plot histogram, curve, relative curve and polygon
Plot Ascending and descending cumulative frequency.
4. Find the number of workers who have wages less than 358.
5.
Find the percentage of the number of workers who their wages ranging are
between (25-55)S.
P
Expert Solution
This question has been solved!
Explore an expertly crafted, step-by-step solution for a thorough understanding of key concepts.

Step by step
Solved in 6 steps with 6 images

Recommended textbooks for you
Glencoe Algebra 1, Student Edition, 9780079039897…
Algebra
ISBN:
9780079039897
Author:
Carter
Publisher:
McGraw Hill

Holt Mcdougal Larson Pre-algebra: Student Edition…
Algebra
ISBN:
9780547587776
Author:
HOLT MCDOUGAL
Publisher:
HOLT MCDOUGAL
Glencoe Algebra 1, Student Edition, 9780079039897…
Algebra
ISBN:
9780079039897
Author:
Carter
Publisher:
McGraw Hill
Holt Mcdougal Larson Pre-algebra: Student Edition…
Algebra
ISBN:
9780547587776
Author:
HOLT MCDOUGAL
Publisher:
HOLT MCDOUGAL