H0: μd >, =, ≠, or < ______________ cm (Type an integers or decimals. Do not round.) H1: μd >, =, ≠, or < ______________ cm (Type an integers or decimals. Do not round.)
H0: μd >, =, ≠, or < ______________ cm (Type an integers or decimals. Do not round.) H1: μd >, =, ≠, or < ______________ cm (Type an integers or decimals. Do not round.)

MATLAB: An Introduction with Applications
6th Edition
ISBN:9781119256830
Author:Amos Gilat
Publisher:Amos Gilat
Chapter1: Starting With Matlab
Section: Chapter Questions
Problem 1P

Related questions
Question
H0: μd >, =, ≠, or < ______________ cm (Type an integers or decimals. Do not round.)
H1: μd >, =, ≠, or < ______________ cm (Type an integers or decimals. Do not round.)
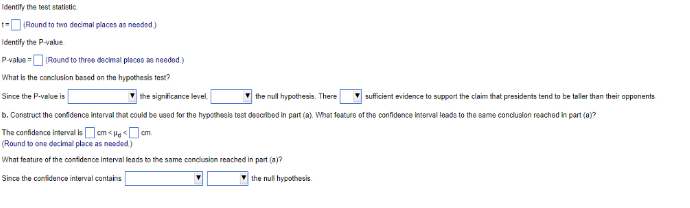
Transcribed Image Text:Identify the test statistic
t= (Round to two decimal places as needed)
Identify the P-value.
P-value =
(Round to three decimal places as needed.)
What is the conclusion based on the hypothesis test?
Since the P-value is
the significance level.
the null hypothesis. There
b. Construct the confidence interval that could be used for the hypothesis test described in part (a). What feature of the confidence interval leads to the same conclusion reached in part (a)?
The confidence interval is cm<Hd <cm.
(Round to one decimal place as needed)
What feature of the confidence interval leads to the same conclusion reached in part (a)?
Since the confidence interval contains
the null hypothesis.
sufficient evidence to support the claim that presidents tend to be taller than their opponents.
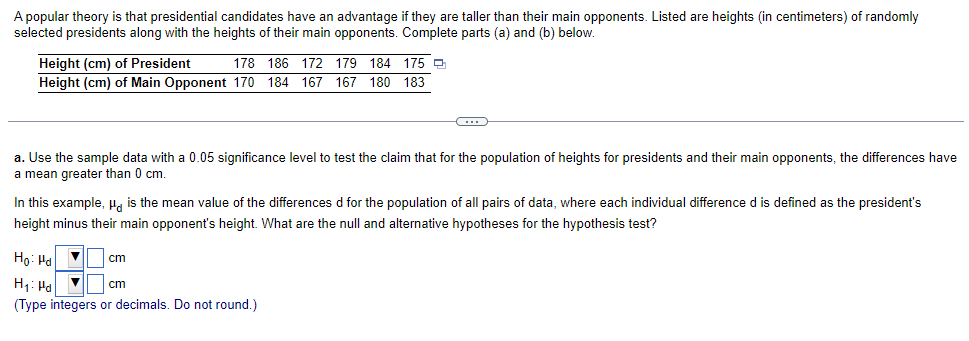
Transcribed Image Text:A popular theory is that presidential candidates have an advantage if they are taller than their main opponents. Listed are heights (in centimeters) of randomly
selected presidents along with the heights of their main opponents. Complete parts (a) and (b) below.
Height (cm) of President
178 186 172 179 184 175
Height (cm) of Main Opponent 170 184 167 167 180 183
a. Use the sample data with a 0.05 significance level to test the claim that for the population of heights for presidents and their main opponents, the differences have
a mean greater than 0 cm.
C
In this example, H is the mean value of the differences d for the population of all pairs of data, where each individual difference d is defined as the president's
height minus their main opponent's height. What are the null and alternative hypotheses for the hypothesis test?
Ho: Pd
H₁: Ha V
cm
(Type integers or decimals. Do not round.)
cm
Expert Solution
This question has been solved!
Explore an expertly crafted, step-by-step solution for a thorough understanding of key concepts.

Step by step
Solved in 4 steps with 42 images

Recommended textbooks for you
MATLAB: An Introduction with Applications
Statistics
ISBN:
9781119256830
Author:
Amos Gilat
Publisher:
John Wiley & Sons Inc

Probability and Statistics for Engineering and th…
Statistics
ISBN:
9781305251809
Author:
Jay L. Devore
Publisher:
Cengage Learning

Statistics for The Behavioral Sciences (MindTap C…
Statistics
ISBN:
9781305504912
Author:
Frederick J Gravetter, Larry B. Wallnau
Publisher:
Cengage Learning
MATLAB: An Introduction with Applications
Statistics
ISBN:
9781119256830
Author:
Amos Gilat
Publisher:
John Wiley & Sons Inc
Probability and Statistics for Engineering and th…
Statistics
ISBN:
9781305251809
Author:
Jay L. Devore
Publisher:
Cengage Learning
Statistics for The Behavioral Sciences (MindTap C…
Statistics
ISBN:
9781305504912
Author:
Frederick J Gravetter, Larry B. Wallnau
Publisher:
Cengage Learning

Elementary Statistics: Picturing the World (7th E…
Statistics
ISBN:
9780134683416
Author:
Ron Larson, Betsy Farber
Publisher:
PEARSON

The Basic Practice of Statistics
Statistics
ISBN:
9781319042578
Author:
David S. Moore, William I. Notz, Michael A. Fligner
Publisher:
W. H. Freeman

Introduction to the Practice of Statistics
Statistics
ISBN:
9781319013387
Author:
David S. Moore, George P. McCabe, Bruce A. Craig
Publisher:
W. H. Freeman