H0 (null hypothesis): μ1 = μ2 = μ3 = μ4 = μ5 (all the population means are equal) H1 (null hypothesis): at least one population mean is different from the rest Where μ1, μ2, μ3, μ4, μ5 are average daily returns (on the stock you are assigned) on MON, TUE, WED, THR, and FRI respectively. Please explain your answe


Q: DI D2 D3 D4 D5 59920 Question 2: Discrete random variables (30 Points) A factory has in stock 300 kg…
A: Random variable A variable may be a variable whose value is unknown or a function that assigns…
Q: etermine whether the distribution is a probability distribution. 0 1 3 1 4 50 X P(x) 2 1 2 3 1 10 4…
A: Given that Probability distribution. X 0 1 2 3 4 5 P(x) 3/4 1/50 1/2 1/10 1/20 3/5
Q: Tree heights: Cherry trees in a certain orchard have heights that are normally distributed with mean…
A: Given: Mean,u= 113 standard deviation σ= 11
Q: Which of the following is a measurement of the co-movement between two variables that ranges between…
A: The correlation coefficient is a statistical measure of the strength of the relationship between the…
Q: diets more ene for weight loss A sample of 48 subjects we low-carbohydrate diet for six months. At…
A: here two samples are given and ask the difference of means in them So we will use test of…
Q: Hypotheses for a chi-square goodness-of-fit test are given, along with the sample data and the…
A:
Q: Find the indicated area under the standard normal curve. To the right of z=0.01 The area to…
A: Given that. X~N( 0 , 1 ) μ=0 , ?=1 (for standard normal distribution) Z-score =( x - μ )/?
Q: 13. Contaminated water: The concentration of benzene was atlu291 measured in units of milligrams per…
A: From the provided information,
Q: s according to the Mars candy company can be found in the table below. In addition, the table…
A: blue brown green orange red yellow Total Observed Frequencies 474 379 489 550 363 359 2614…
Q: The table below shows the average weekly wages (in dollars) for state government employees and…
A: Given: The equation of the regression line is: y^ = 1.386X + 12.604 n = 10 Formula Used: Prediction…
Q: In a recent study, 20 males used a new weight-loss supplement, and 14 of them experienced weight…
A: Given datain a recent study20 males used a new weight loss supplement and 14 of them experienced…
Q: 11 TB MC Qu. 05-48 (Static) Consider a Treasury bill with a... Consider a Treasury bill with a rate…
A: Given that: Following are the risky securities: Security A: E(r) = 0.15; variance = 0.0400 Security…
Q: Three (3) treatments were compared using a completely randomized design. The data are shown below.…
A:
Q: Find the indicated probabilities using the geometric distribution, the Poisson distribution, or the…
A: The mean is 3.
Q: A normal distribution has µ = 20 and σ = 4. Which is the probability of randomly selecting a score…
A: Given that. X~N( μ , ?^2 ) μ=20 , ?=4 Z-score =( x - μ )/?
Q: Z is distributed with the standard normal distribution. Write answers to the nearest 4 decimal…
A: Provided information: Z score = 1.8 (Right tailed)
Q: a. Determine the sample proportions. Determine the sample proportion P₁. P₁ = [ Determine the sample…
A: Followings are the Explanation of the question Use the Two sample Z proportion test
Q: Executives at The Thinking Channel have decided to test whether the educational backgrounds of the…
A: Given data is as follows: Percent of population,p Observed, Fo Less than high school 0.12 19…
Q: 3. The following data are the heights in centimeters of 200 female students in a certain college.…
A: Given information: Length Frequency 150 < X < 155 21 155 < X < 160 44 160 <…
Q: manufacturer knows that their items have a lengths that are skewed right, with a mean of 19.3…
A: Given that. X~N( μ , ?^2 ) μ=19.3 , ?=5.7 ,n=48 Z-score =( x - μ )/?
Q: Then determine if the events are unusual. It convenient, use the appropriate probability table or…
A:
Q: The number of AIDS cases in a particular country in 2013, by region and race, is as shown in the…
A:
Q: 2) Using a 95% level of confidence, test the claim College GPA's have a mean of 3.0.
A: Data set is: College GPA 3.68 3.1 2.72 3.61 4 3.89 3.51 2.64 3.33 3.32…
Q: he chi-square statistic is given for a test for association, along with the two-way table showing…
A: Given: Chi-square statistic χ2 = 34.241 Formula Used: Degree of freedom = (Row -1)×(Column -1)
Q: A researcher plans to study the causal effect of police on crime using data from a random sample of…
A: Due to the lack of parameters or actual data to assess it, this regression may produce an omitted…
Q: Big babies: The National Health Statistics Reports described a study in which a sample of 330…
A: We have given thatSample size (n) = 330Sample mean (x̅) = 25.4Standard deviations (s) =…
Q: 2. The following table lists the price (RM) of certain randomly selected college textbooks in…
A: Solution: k= 4 groups The excel data analysis tab output is
Q: A researcher is interested in exploring the relationship between calcium intake and weight loss. Two…
A: The following information has been given: x¯1=10.4 x¯2=10.6s1=1.2 s2=1.9n1=29…
Q: An electronic device has lifetime denoted by T. The device has value V = 5 if it fails before time t…
A:
Q: A random sample of 149 full-grown lobsters had a mean weight of 15 ounces. Assume that population…
A:
Q: d. The p-value = e. The p-value is ? ✓ a f. Based on this, we should [Select an answer the null…
A: Given that Sample size n =57 Sample mean =252 Sample standard deviation =26.2
Q: We wish to estimate what percent of adult residents in a certain county are parents. Out of 100…
A: Given n=100 X=77 At 99% CI is 2.576
Q: A Caviar food packaging system provides the following weight after filling the packages. The goal is…
A: Given data
Q: Use the TI-84 Plus calculator to find the z-scores that bound the middle 80% of the area under the…
A:
Q: Listed below are amounts (in millions of dollars) collected from parking meters by a security…
A:
Q: Books: Josephine has three chemistry books, three history books, and six statistics books. She wants…
A: Given data 3 chemistry books 3 history books 6 statistics books ______________________ 12 total…
Q: through (c) below. Students Given Four Quarters Students Given a $1 Bill either four quarters or…
A:
Q: A manufacturing company designed a Factorial Experiment to determine whether the number of defective…
A: Hypothesis of interaction effect in the factorial designs H0: There is no interaction between the…
Q: in a one-tail hypothesis test where H_{0} is only rejected in the upper tail, the p-value 0.1029 and…
A: Decision rule for hypothesis test using p-value : Reject null hypothesis (H0) is p-value less than…
Q: Each bit transmitted through a channel has a 10% chance to be transmitted in error. Assume that the…
A: Dear student, If you find this solution helpful please upvote ? it. If X~Bin(n,p) Then, P(X=x) =…
Q: Select the graph that best illustrates the following distribution shape: Skewed to the left
A: Here we have to identify the graph which is Skewed to the left from the given option
Q: While her husband spent 2½ hours picking out new speakers, a statistician decided to determine…
A: The complete solution and result is in images uploaded below. Thanks!
Q: The number of AIDS cases in a particular country in 2013, by region and race, is as shown in the…
A: As per Bartleby guidelines I can't answer more than three sub parts per post. Please post other…
Q: Gender of Children (Example 10) A married couple plans to have four children, an- they are wondering…
A: These are the four required conditions to be binomial experiment. 1 The number of observations n is…
Q: The state test scores for 12 randomly selected high school seniors are shown on the right. Complete…
A: Given data is1426,1223,980,699,727,833,723,749,541,629,1445,944sample size(n)=12
Q: A survey of 1021 U.S. adults found that 45.1% have a favorable view of Cuba. Identify the population…
A: The question is about prop. Given : No. of adults under survey ( n ) = 1021 Prop. of adults who have…
Q: Copepods are tiny crustaceans that are an essential link in the estuarine food web. Marine…
A:
Q: The body temperatures of a group of healthy adults have a bell-shaped distribution with a mean of…
A: Mean = 98.25 Standard deviation = 0.66
Q: 14. Exercise: Medical researchers conducted a study to determine whether treadmill exercise could…
A: According to the given information in this question We need to apply t test for two means
Q: Number of classes: 8 Data set: Reaction times (in milliseconds) of 30 adult females to an auditory…
A: since the minimum number is 291 and greatest is 514 so we will make class of width 30 as it does not…
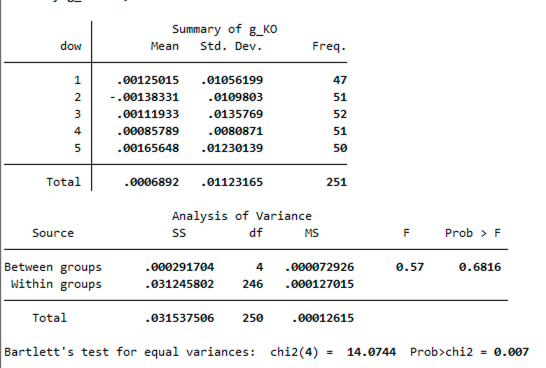
H0 (null hypothesis): μ1 = μ2 = μ3 = μ4 = μ5 (all the population means are equal)
H1 (null hypothesis): at least one population
Where μ1, μ2, μ3, μ4, μ5 are average daily returns (on the stock you are assigned) on MON, TUE, WED, THR, and FRI respectively. Please explain your answer.


Trending now
This is a popular solution!

Step by step
Solved in 2 steps

- Suppose a researcher studied sleeping patterns in second-, fourth-, and sixth-grade children, and there were 7 students in each group, showing sleep periods in minutes below. Grade 2nd 4th 6th 580 525 562 570 575 532 594 497 565 543 478 537 552 517 525 506 455 493 537 532 490 Mean minutes participants slept 562.57 527.00 505.43 Suppose the researcher found significant ANOVA test result: the observed F statistic is 7.14 at alpha= .05 level, and the researcher made the decision to reject the null hypothesis. Finish up the ANOVA test with your interpretation in terms of the research question (you do not need to perform the test, just provide interpretation based the information available). Your interpretation: Given MSerror= 41, conduct the Tukey’s HSD post-hoc test to determine which groups differed significantly from one another. Include your calculation work, and show each comparison and state the outcome of each…Hamstrings Athletes who had suffered hamstringinjuries were randomly assigned to one of two exerciseprograms. Those who engaged in static stretchingreturned to sports activity in a mean of 15.2 days fasterthan those assigned to a program of agility and trunkstabilization exercises. (Journal of Orthopaedic & SportsPhysical Therapy 34 [March 2004]: 3)a) Explain why it was important to assign the athletes tothe two different treatments randomly.b) There was no control group consisting of athleteswho did not participate in a special exercise program.Explain the advantage of including such a group.c) How might blinding have been used?d) One group returned to sports activity in a mean of37.4 days 1SD = 27.6 days2 and the other in a meanof 22.2 days 1SD = 8.3 days2. Do you think thisdifference is statistically significant? Explain.The data processing department of the Arizona Bank has five data entry clerks. Each working day their supervisor verifies the accuracy of a random sample of 250 records. A record containing one or more errors is considered defective and must be redone. The results of the last 30 samples are shown in the table. All were checked to make sure that none was out of control. Sample Number of DefectiveRecords Sample Number of DefectiveRecords Sample Number of DefectiveRecords Sample Number of DefectiveRecords 1 2 3 4 5 6 7 8 7 5 19 10 11 8 12 9 9 10 11 12 13 14 15 16 6 13 18 5 16 4 11 8 17 18 19 20 21 22 23 12 4 6 11 17 12 6 24 25 26 27 28 29 30 Total 7 13 10 14 6 11 9 300 a. Based on these historical data, set up a p-chart using z = 3.b. Samples for the next 4 days showed the following: Sample Number of Defective Records Tues Wed Thurs Fri 17 15 22 21 What is the supervisor’s assessment of the data-entry process likely to be?
- Suppose that the average waiting time for a patient at a physician's office is just over 29 minutes. In order to address the issue of long patient wait times, some physicians' offices are using wait-tracking systems to notify patients of expected wait times. Patients can adjust their arrival times based on this information and spend less time in waiting rooms. The following data show wait times (minutes) for a sample of patients at offices that do not have a wait-tracking system and wait times for a sample of patients at offices with a wait-tracking system. Without Wait-Tracking System With Wait-TrackingSystem 24 14 60 9 10 33 22 10 34 18 47 30 12 12 12 17 27 9 30 3 (a) Considering only offices without a wait-tracking system, what is the z-score for the 10th patient in the sample (wait time = 30 minutes)? If required, round your intermediate calculations and final answer to two decimal places. z-score = (b) Considering only offices…Suppose that the average waiting time for a patient at a physician's office is just over 29 minutes. In order to address the issue of long patient wait times, some physicians' offices are using wait-tracking systems to notify patients of expected wait times. Patients can adjust their arrival times based on this information and spend less time in waiting rooms. The following data show wait times (minutes) for a sample of patients at offices that do not have a wait-tracking system and wait times for a sample of patients at offices with a wait-tracking system. Without Wait-Tracking System With Wait-TrackingSystem 20 8 56 12 12 11 35 16 26 32 48 36 16 8 10 9 27 15 36 5 (a) Considering only offices without a wait-tracking system, what is the z-score for the 10th patient in the sample (wait time = 36 minutes)? If required, round your intermediate calculations and final answer to two decimal places. z-score = (b) Considering only offices…A bank with a branch located in a commercial district of a city has the business objective of developing an improved process for serving customers during the noon-to-1 p.m. lunch period. Management decides to first study the waiting time in the current process. The waiting time is defined as the time that elapses from when the customer enters the line until he or she reaches the teller window. Data are collected from a random sample of 35 customers. Suppose that another branch, located in a residential area, is also concerned with improving the process of serving customers in the noon-to-1 p.m. lunch period. Data are collected from a random sample of 40 customers. The obtained data from the two branches are stored. At the 5% significance level, is there evidence of a difference in the mean waiting time between the two branches? What is/are implications of the result?
- A Deputy Registrar at a certainty university conducted a Chi-Square test of association to establish whether or not employee grade and level of absenteeism were associated. Table 2 below shows part of the results which were obtained. Table 2: Cross tabulation of employee grade and level of absenteeism Contingency Tables Grade LAbsence 1 2 3 Total low Observed 8 1 0 9 Expected 2.90 3.48 2.61 9.00 high Observed 2 11 9 22 Expected 7.10 8.52 6.39 22.00 Total Observed 10 12 9 31 Expected 10.00 12.00 9.00 31.00 2.1 State the appropriate measurement scales for the variables. 2.2 State the null and alternative hypotheses. 2.3 Calculate the expected frequency corresponding to a Grade 3 academic with a high level of absenteeism. 2.4 Find the Chi-Square critical value and test statistic.…A Deputy Registrar at a certainty university conducted a Chi-Square test of association to establish whether or not employee grade and level of absenteeism were associated. Table 2 below shows part of the results which were obtained. Table 2: Cross tabulation of employee grade and level of absenteeism Contingency Tables Grade LAbsence 1 2 3 Total low Observed 8 1 0 9 Expected 2.90 3.48 2.61 9.00 high Observed 2 11 9 22 Expected 7.10 8.52 6.39 22.00 Total Observed 10 12 9 31 Expected 10.00 12.00 9.00 31.00 2.2 State the null and alternative hypotheses.A Deputy Registrar at a certainty university conducted a Chi-Square test of association to establish whether or not employee grade and level of absenteeism were associated. Table 2 below shows part of the results which were obtained. Table 2: Cross tabulation of employee grade and level of absenteeism Contingency Tables Grade LAbsence 1 2 3 Total low Observed 8 1 0 9 Expected 2.90 3.48 2.61 9.00 high Observed 2 11 9 22 Expected 7.10 8.52 6.39 22.00 Total Observed 10 12 9 31 Expected 10.00 12.00 9.00 31.00 2.3 Calculate the expected frequency corresponding to a Grade 3 academic with a high level of absenteeism.
- A Deputy Registrar at a certainty university conducted a Chi-Square test of association to establish whether or not employee grade and level of absenteeism were associated. Table 2 below shows part of the results which were obtained. Table 2: Cross tabulation of employee grade and level of absenteeism Contingency Tables Grade LAbsence 1 2 3 Total low Observed 8 1 0 9 Expected 2.90 3.48 2.61 9.00 high Observed 2 11 9 22 Expected 7.10 8.52 6.39 22.00 Total Observed 10 12 9 31 Expected 10.00 12.00 9.00 31.00 2.4 Find the Chi-Square critical value and test statistic. Hence, conduct a Chi-Square test of association at 5% level of significance clearly stating your decision and conclusion.A Deputy Registrar at a certainty university conducted a Chi-Square test of association to establish whether or not employee grade and level of absenteeism were associated. Table 2 below shows part of the results which were obtained. Table 2: Cross tabulation of employee grade and level of absenteeism Contingency Tables Grade LAbsence 1 2 3 Total low Observed 8 1 0 9 Expected 2.90 3.48 2.61 9.00 high Observed 2 11 9 22 Expected 7.10 8.52 6.39 22.00 Total Observed 10 12 9 31 Expected 10.00 12.00 9.00 31.00 2.1 State the appropriate measurement scales for the variables.The Occupational Safety and Health Administration (OSHA) mandates certain regulations that have to be adopted by corporations. Prior to the implementation of the OSHA program, a company found that for a sample of 40 randomly selected months, the mean employee time lost due to job-related accidents was 45 hours. After implementation of the OSHA program, for a random sample of 45 months, the mean employee time lost due to job-related accidents was 39 hours. It can be assumed that the variability of time lost due to accidents is about the same before and after implementation of the OSHA program (with a standard deviation being 3.5 hours). Find a 90% confidence interval for the difference in the mean time lost due to accidents. Test the hypothesis that implementation of the OSHA program has reduced the mean employee lost time. Use a level of significance of 0.10.


