Hammer arm length = 100 cm Q3/ the accompanying table contain data abtained during a tensile test for a given specimen of steel. The specimen had an original diameter of 0.5 in and gage length (Lo) of 2.00in see on right. Use the tabulated data, process it, and plot the conventional stress-strain curve then give the estimated values for the following properties : 1- Yield strength 2- tensile strength 3- young module 4- fracture strength Load (Ib) Elongation (in) 0. 2000 0.0002 6000 0.0006 10000 0.0019 12000 12900 0.0033 0.0043 0.0047 13400 13600 0.0054 13800 0.0063 14000 0.0090 14400 0.0102 15200 16800 0.0130 0.0230 18400 0.0336 20000 0.0552 20300 0.0700 19900 0.0900 19500 0.1050 19000 0.1200
Hammer arm length = 100 cm Q3/ the accompanying table contain data abtained during a tensile test for a given specimen of steel. The specimen had an original diameter of 0.5 in and gage length (Lo) of 2.00in see on right. Use the tabulated data, process it, and plot the conventional stress-strain curve then give the estimated values for the following properties : 1- Yield strength 2- tensile strength 3- young module 4- fracture strength Load (Ib) Elongation (in) 0. 2000 0.0002 6000 0.0006 10000 0.0019 12000 12900 0.0033 0.0043 0.0047 13400 13600 0.0054 13800 0.0063 14000 0.0090 14400 0.0102 15200 16800 0.0130 0.0230 18400 0.0336 20000 0.0552 20300 0.0700 19900 0.0900 19500 0.1050 19000 0.1200

Mechanics of Materials (MindTap Course List)
9th Edition
ISBN:9781337093347
Author:Barry J. Goodno, James M. Gere
Publisher:Barry J. Goodno, James M. Gere
Chapter7: Analysis Of Stress And Strain
Section: Chapter Questions
Problem 7.7.19P: During a test of an airplane wing, the strain gage readings from a 45° rosette (see figure) are as...

Related questions
Question
I need the answer as soon as possible
Transcribed Image Text:Hammer arm length = 100 cm
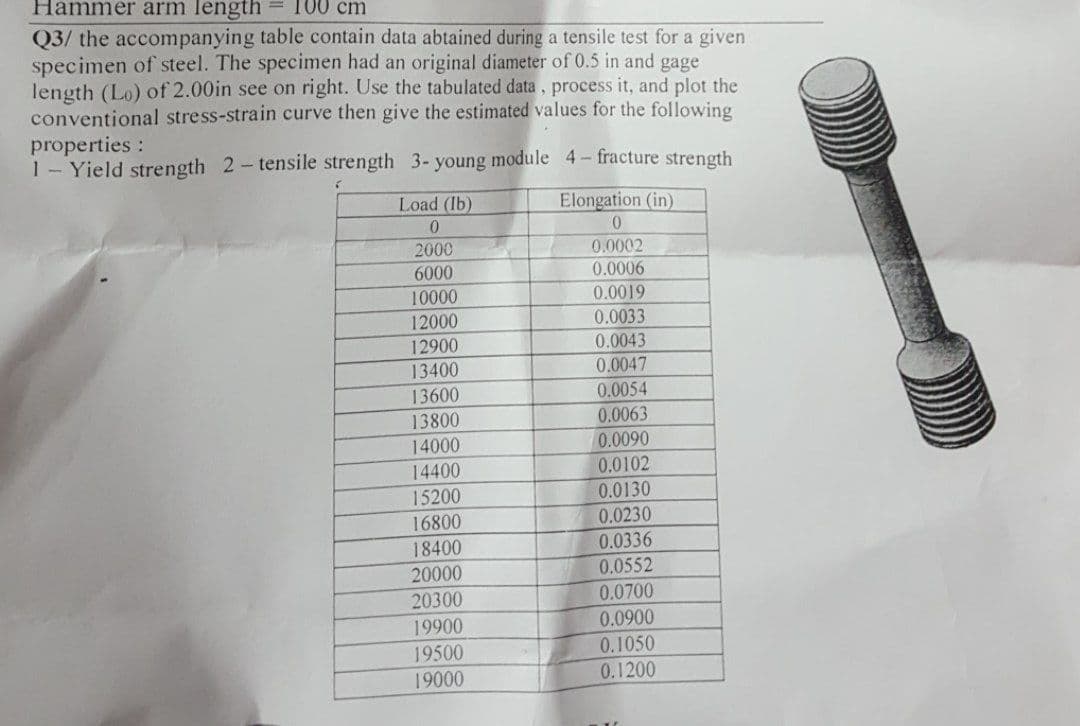
Q3/ the accompanying table contain data abtained during a tensile test for a given
specimen of steel. The specimen had an original diameter of 0.5 in and gage
length (Lo) of 2.00in see on right. Use the tabulated data, process it, and plot the
conventional stress-strain curve then give the estimated values for the following
properties :
1- Yield strength 2- tensile strength 3- young module 4- fracture strength
Load (Ib)
Elongation (in)
0.
2000
0.0002
6000
0.0006
10000
12000
0.0019
0.0033
12900
0.0043
0.0047
13400
13600
0.0054
13800
0.0063
0.0090
0.0102
14000
14400
15200
16800
18400
0.0130
0.0230
0.0336
20000
0.0552
0.0700
20300
19900
19500
19000
0.0900
0.1050
0.1200
Expert Solution
This question has been solved!
Explore an expertly crafted, step-by-step solution for a thorough understanding of key concepts.

Step by step
Solved in 2 steps with 4 images

Knowledge Booster


Learn more about
Need a deep-dive on the concept behind this application? Look no further. Learn more about this topic, mechanical-engineering and related others by exploring similar questions and additional content below.Recommended textbooks for you
Mechanics of Materials (MindTap Course List)
Mechanical Engineering
ISBN:
9781337093347
Author:
Barry J. Goodno, James M. Gere
Publisher:
Cengage Learning
Mechanics of Materials (MindTap Course List)
Mechanical Engineering
ISBN:
9781337093347
Author:
Barry J. Goodno, James M. Gere
Publisher:
Cengage Learning