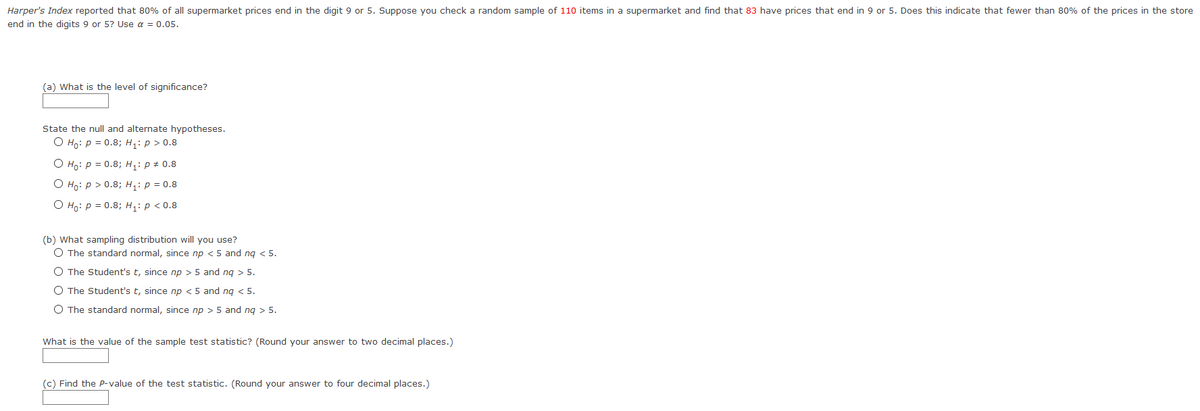
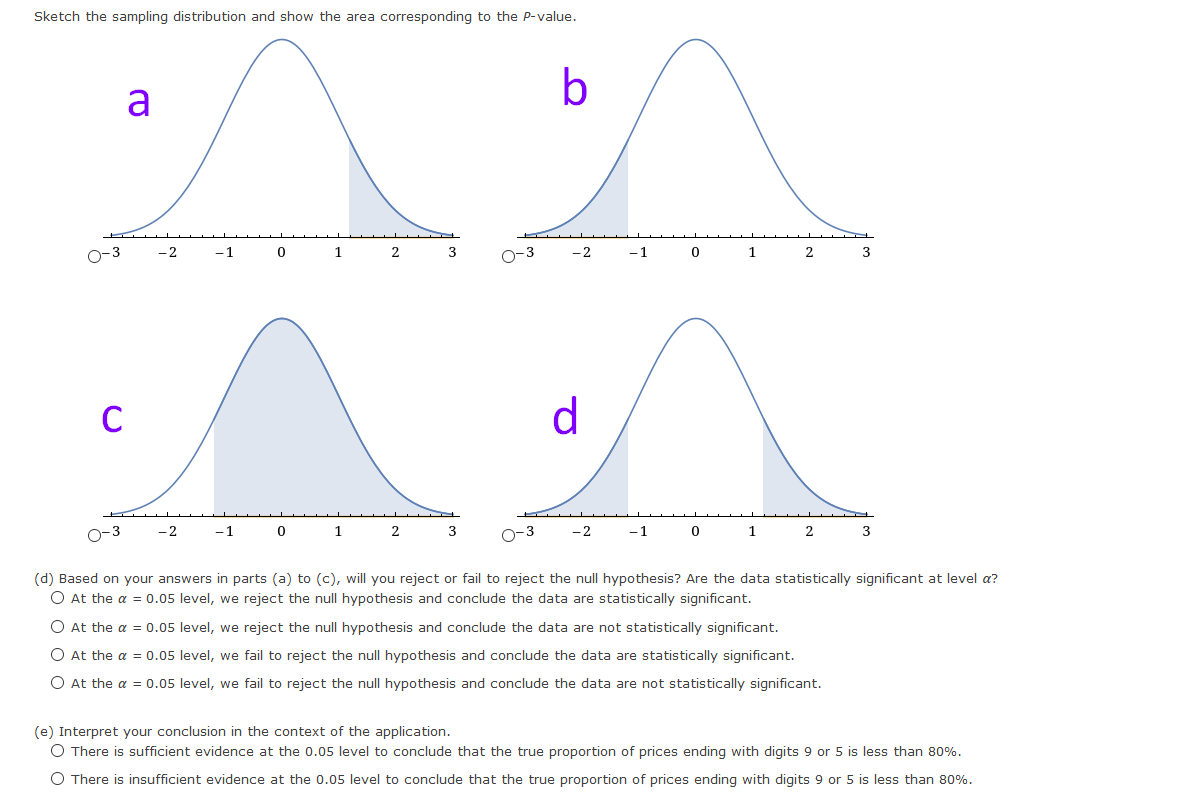
Harper's Index reported that 80% of all supermarket prices end in the digit 9 or 5. Suppose you check a random sample of 110 items in a supermarket and find that 83 have prices that end in 9 or 5. Does this indicate that fewer than 80% of the prices in the store end in the digits 9 or 5? Use a = 0.05. (a) What is the level of significance? State the null and alternate hypotheses. O Ho: P = 0.8; H: p> 0.8 O Họ: p = 0.8; H,: p + 0.8 O Ho: p > 0.8; H: p = 0.8 O Hg: p = 0.8; H,:p < 0.8 (b) What sampling distribution will you use? O The standard normal, since np <5 and ng <5. O The Student's t, since np > 5 and ng > 5. O The Student's t, since np <5 and ng < 5. O The standard normal, since np > 5 and ng > 5. What is the value of the sample test statistic? (Round your answer to two decimal places.) (c) Find the P-value of the test statistic. (Round your answer to four decimal places.)


Inverse Normal Distribution
The method used for finding the corresponding z-critical value in a normal distribution using the known probability is said to be an inverse normal distribution. The inverse normal distribution is a continuous probability distribution with a family of two parameters.
Mean, Median, Mode
It is a descriptive summary of a data set. It can be defined by using some of the measures. The central tendencies do not provide information regarding individual data from the dataset. However, they give a summary of the data set. The central tendency or measure of central tendency is a central or typical value for a probability distribution.
Z-Scores
A z-score is a unit of measurement used in statistics to describe the position of a raw score in terms of its distance from the mean, measured with reference to standard deviation from the mean. Z-scores are useful in statistics because they allow comparison between two scores that belong to different normal distributions.
Harper's Index reported that 80% of all supermarket prices end in the digit 9 or 5. Suppose you check a random sample of 110 items in a supermarket and find that 83 have prices that end in 9 or 5. Does this indicate that fewer than 80% of the prices in the store end in the digits 9 or 5? Use ? = 0.05.


Trending now
This is a popular solution!

Step by step
Solved in 2 steps with 5 images


