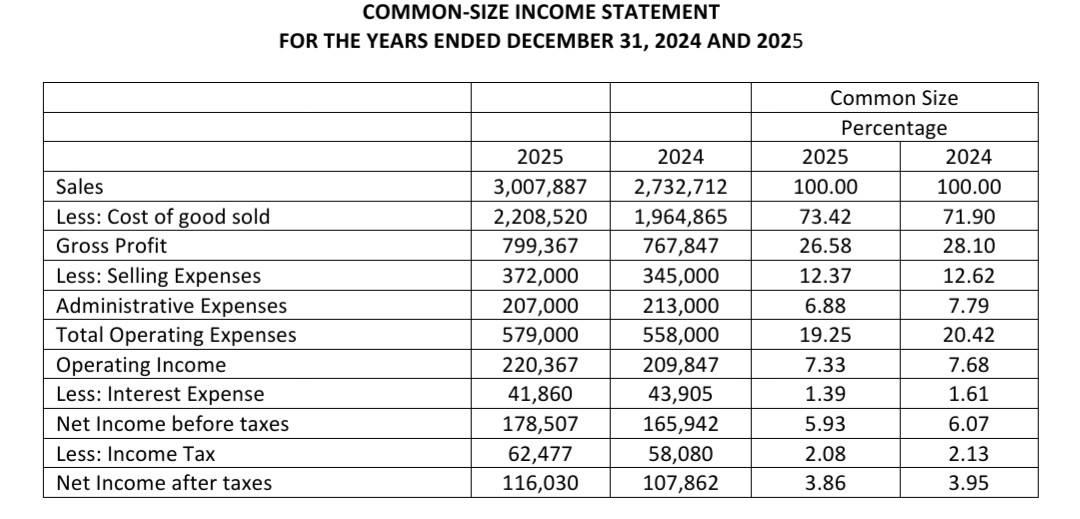
hat does the vertical analysis reveal for ABC corporation in terms of Income Statement


Q: how do I analyze changes in a company's equity
A: This shows the capital of the company.
Q: A common-size balance sheet shows the firm's assets and liabilities as a percentage of ____. a.…
A: Balance sheets are shown in different ways. One is common size
Q: Earnings per share a.helps compare companies of different sizes b.all of the answers are correct…
A: Earnings per share represent the net profit earned by the company for each share. Earnings per share…
Q: What is comprehensive income? How does comprehensive income differ from net income? Where do…
A: Comprehensive income:Comprehensive income represents the amount of net income plus other…
Q: Using these data from the comparative balance sheet of Rollaird Company, perform horizontal…
A: Comparative balance sheet: A comparative balance sheet represents the financial differences between…
Q: Vertical Analysis Income statement information for Einsworth Corporation follows:
A: Vertical analysis is a very popular financial statement analysis method. In this method each item on…
Q: Which of the following statements regarding the income statement is true?a. The income statement…
A: The financial statements of the business are prepared for presenting the results of operations…
Q: Return on equity…… Select one: a. is calculated by dividing net income plus preferred dividends by…
A: Introduction: Preferred shares: Preferred share holders receive preferred dividend before…
Q: Return on equitya. is a measure of the ratio of net income to dividends declared.b. is calculated…
A: Ratio analysis: It can be defined as a quantitative method of analyzing the financial statements of…
Q: What is the purpose of published financial statements for companies and the ratio analysis?
A: Financial Statement-Financial statements provide information about a company's performance,…
Q: Property, plant and equipment Total Assets Liabilities and Stockholders' Equity Current liabilities…
A:
Q: What is the most commonly used base item for a common size income statement? O Net sales Total…
A: The income statement is the statement showing the profits and losses made during the year. The…
Q: How does the return on common equity show the relationship between net income and the common…
A: The return on equity is the percentage earned on the equity investment made by the company. It shows…
Q: Describe the procedures a company followswhen it makes a distribution through dividendpayments.
A: Answer: The company follows the following procedures through the dividend payments while making…
Q: Comparing dividends per share to earnings per share indicates the extent to which the corporation is…
A: Dividend is the amount distributed to the shareholders out of excess profits.
Q: Match each ratio that follows to its use. Items may be used more than once. Indicate…
A: Definition: Ratio analysis: Ratio analysis is a quantitative method of gaining insight into a…
Q: How are the earnings per share important piece of financial information provided in the income…
A:
Q: Earnings per share a. must be reported by public company b. all of the answers are correct c. is the…
A: Earnings per share is the net income after deducting all the expenses and dividends. It is the…
Q: Why a company needs to publish the ratio analysis and financial statements of the companies
A: Ratio analysis and financial statements of the company provides a clear image on the financial…
Q: The primary focus of horizontal analysis isa. the income statement only.b. the balance sheet only.c.…
A: Financial statements can be analysed by using two methods. 1) Vertical method. 2) Horizontal method.…
Q: Income Statement and Balance Sheet. Complete the per share data in the balance sheet.
A: earning per share = net income - preferred dividend / weighted average no of common shares…
Q: What is the company's dividend policy
A: Dividend is some portion of company’s profit that the shareholders get for investing their money in…
Q: Which one of the following is the ultimate objective of modern financial management for a…
A: objective of financial manager is to maximise shareholders value.
Q: Resources of a company are referred to asa. Liabilities. b. Stockholders’ equity. c. Dividends. d.…
A: Assets: Assets are those items that provide value for money and future economic benefit for an…
Q: Which of the following is true regarding the incomestatement?a. The income statement is sometimes…
A: Income statement: The financial statement which reports revenues and expenses from business…
Q: Share dividends distributable should be classified on the O income statement as an expense.…
A: Introduction;- A dividend is a share of company profits. Which is distributed to to its…
Q: hat does the vertical analysis reveal for ABC corporation in terms of Implications to Financial…
A: Vertical analysis of the financial statement is the technique of analyzing the items of the…
Q: he two companies: Sales to Y Sales to others Cost of goods sol Cost of goods sol
A: Intercompany sales mean that sales are made by one company of the group of companies to the other…
Q: What does the vertical analysis reveal on ABC Corporation in terms of Statement of Financial…
A: Answer: Vertical analysis of financial statements is an approach to explain relationship between…
Q: Based on which of the following concepts, is share capital account shown on the liability side of a…
A: Business entity concept says that both businessmen and business are separate person. Business has…
Q: he information below construct an income statement. Calculate the firm’s earnings per share…
A: 2 The income statement shows the financial impact of the company's current activities throughout the…
Q: The financial statement that shows the profitability of a business entity is known as: Group of…
A: Financial statements are prepared to show the financial position, financial performance and cash…
Q: 1. Define comprehensive income. What are the ways companies can present comprehensive income? 2. How…
A:
Q: How does comprehensive income differ from net income? Where do companiesreport it in a balance…
A: Definition: Comprehensive income: Comprehensive income represents the amount of net income plus…
Q: earnings per share
A: Earnings per share is an accounting metric used to evaluate the earnings available to equity…
What does the vertical analysis reveal for ABC corporation in terms of Income Statement

Step by step
Solved in 2 steps


- Profitability metrics The following selected data were taken from the financial statements of The O'Malley Group Inc. for December 31, 20Y5. 20Y4. and 20Y3: No dividends on common stock were declared between 20Y3 and 20Y5. a.Determine the return on total assets, the return on stockholders' equity, and the return on common stockholders' equity Tor the years 20Y4 and 20Y5. Round to one decimal place. b. What conclusions can be drawn from these data as to the company's profitability?INCOME STATEMENT Year ended June 30 2022 2021 $'000 $'000Revenue 22450 18675Cost of sales 8475 8055Gross Profit 13975 10620Distribution costs 4245 3120Administrative expenses 1276 2134Selling expenses…Prepare the Pro-Forma Statement of Financial Position for the year ending 31 December 2023 INFORMATIONSibiya ProjectsStatement of Comprehensive Income for the year ended 31 December 2022 RSales 10 000 000Cost of sales (5 750 000)Gross profit 4 250 000Variable, selling and administrative costs (1 500 000)Fixed selling and administrative costs (500 000)Net profit 2 250 000 Statement of Financial Position for the year ended 31 December 2022ASSETS RNon-current assets 800 000Property, plant and equipment 800 000 Current assets 3 400 000Inventories 1 600 000Accounts receivable 600 000Cash 1 200 000TOTAL ASSETS 4 200 000 EQUITY AND LIABILITIESEquity 3 760 000 Current liabilities 440 000Accounts payable 440 000TOTAL ASSETS AND LIABILITIES 4 200 000 Additional informationA. The sales budget for 2023 is as follows:First Quarter Second Quarter Third Quarter Fourth QuarterR2 625 000 R2 750 000 R2 875 000 R2 750 000 B. 90% of sales is collected in the quarter of the sale and 10% in the quarter…
- Return on total assets ratio: net income/ average total assets 21,331/(321,195+225,248)/2= 0.07807= 7.8% (2020 year) 11588/(162,648+225,248)/2= 0.059= 6.0% (2019 year) Write financial analysis report.ccounting Assume the following sales data for a company: 2026 $734000 2025 655500 2024 570000 If 2024 is the base year, what is the percentage increase in sales from 2024 to 2025? 129% 29% 115% 15%Solvency and Profitability Trend Analysis Addai Company has provided the following comparative information: 20Y8 20Y7 20Y6 20Y5 20Y4 Net income $1,078,700 $929,900 $781,400 $667,900 $566,000 Interest expense 366,800 334,800 289,100 220,400 175,500 Income tax expense 345,184 260,372 218,792 173,654 135,840 Total assets (ending balance) 8,226,651 8,779,231 6,276,721 6,620,869 5,020,826 Total stockholders' equity (ending balance) 2,543,681 3,148,667 2,003,133 2,553,135 1,531,881 Average total assets 8,502,941 7,527,976 6,448,795 5,517,391 4,722,930 Average stockholders' equity 2,846,174 2,575,900 2,278,134 2,042,508 1,808,307 You have been asked to evaluate the historical performance of the company over the last five years. Selected industry ratios have remained relatively steady at the following levels for the last five years:…
- Solvency and Profitability Trend Analysis Addai Company has provided the following comparative information: 20Y8 20Y7 20Y6 20Y5 20Y4 Net income $1,078,700 $929,900 $781,400 $667,900 $566,000 Interest expense 366,800 334,800 289,100 220,400 175,500 Income tax expense 345,184 260,372 218,792 173,654 135,840 Total assets (ending balance) 8,226,651 8,779,231 6,276,721 6,620,869 5,020,826 Total stockholders' equity (ending balance) 2,543,681 3,148,667 2,003,133 2,553,135 1,531,881 Average total assets 8,502,941 7,527,976 6,448,795 5,517,391 4,722,930 Average stockholders' equity 2,846,174 2,575,900 2,278,134 2,042,508 1,808,307 You have been asked to evaluate the historical performance of the company over the last five years. Selected industry ratios have remained relatively steady at the following levels for the last five years:…How much is the consolidated profit in 2021? A. 310,000B. 320,000C. 301,000D. 336,000Solve for fy22 sales and depreciation a on the 2022 income statement. remember to reference the growth rate provided by Paul.of 0.141 FY21 FY22 Sales $24884886 Blank Cost of Goods Sold $19659044 Other Expenses $2735335 Depreciation $995395 Blank Taxable Income $1493092 Taxes (21%) $313549 Net Income $1179543 Dividends $500,000 Add. to Retained Earnings $679543
- Solvency and Profitability Trend Analysis Addai Company has provided the following comparative information: 20Y8 20Y7 20Y6 20Y5 20Y4 Net income $273,406 $367,976 $631,176 $884,000 $800,000 Interest expense 616,047 572,003 528,165 495,000 440,000 Income tax expense 31,749 53,560 106,720 160,000 200,000 Total assets (ending balance) 4,417,178 4,124,350 3,732,443 3,338,500 2,750,000 Total stockholders’ equity (ending balance) 3,706,557 3,433,152 3,065,176 2,434,000 1,550,000 Average total assets 4,270,764 3,928,396 3,535,472 3,044,250 2,475,000 Average total stockholders' equity 3,569,855 3,249,164 2,749,588 1,992,000 1,150,000 You have been asked to evaluate the historical performance of the company over the last five years. Selected industry ratios have remained relatively steady at the following levels for the last five years: 20Y4–20Y8 Return on total assets 28%…Solvency and Profitability Trend Analysis Addai Company has provided the following comparative information: 20Y8 20Y7 20Y6 20Y5 20Y4 Net income $273,406 $367,976 $631,176 $884,000 $800,000 Interest expense 616,047 572,003 528,165 495,000 440,000 Income tax expense 31,749 53,560 106,720 160,000 200,000 Total assets (ending balance) 4,417,178 4,124,350 3,732,443 3,338,500 2,750,000 Total stockholders’ equity (ending balance) 3,706,557 3,433,152 3,065,176 2,434,000 1,550,000 Average total assets 4,270,764 3,928,396 3,535,472 3,044,250 2,475,000 Average total stockholders' equity 3,569,855 3,249,164 2,749,588 1,992,000 1,150,000 You have been asked to evaluate the historical performance of the company over the last five years. Selected industry ratios have remained relatively steady at the following levels for the last five years: 20Y4–20Y8 Return on total assets 28%…Solvency and Profitability Trend Analysis Addai Company has provided the following comparative information: 20Y8 20Y7 20Y6 20Y5 20Y4 Net income $273,406 $367,976 $631,176 $884,000 $800,000 Interest expense 616,047 572,003 528,165 495,000 440,000 Income tax expense 31,749 53,560 106,720 160,000 200,000 Total assets (ending balance) 4,417,178 4,124,350 3,732,443 3,338,500 2,750,000 Total stockholders’ equity (ending balance) 3,706,557 3,433,152 3,065,176 2,434,000 1,550,000 Average total assets 4,270,764 3,928,396 3,535,472 3,044,250 2,475,000 Average total stockholders' equity 3,569,855 3,249,164 2,749,588 1,992,000 1,150,000 You have been asked to evaluate the historical performance of the company over the last five years. Selected industry ratios have remained relatively steady at the following levels for the last five years: 20Y4–20Y8 Return on total assets 28%…
