have attached an image for the question, please include instructions on how to figure this out if
have attached an image for the question, please include instructions on how to figure this out if

Holt Mcdougal Larson Pre-algebra: Student Edition 2012
1st Edition
ISBN:9780547587776
Author:HOLT MCDOUGAL
Publisher:HOLT MCDOUGAL
Chapter1: Variables, Expressions, And Integers
Section1.5: Adding Integers
Problem 45E

Related questions
Question
I have attached an image for the question, please include instructions on how to figure this out if possible with stat crunch or excel.
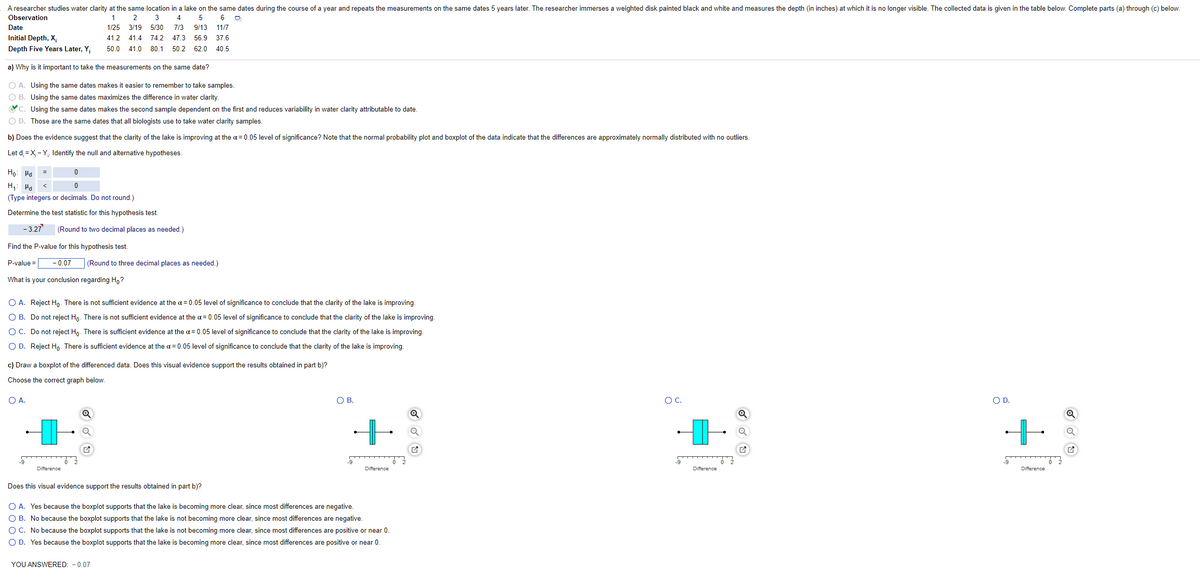
Transcribed Image Text:A researcher studies water clarity at the same location in a lake on the same dates during the course of a year and repeats the measurements on the same dates 5 years later. The researcher immerses a weighted disk painted black and white and measures the depth (in inches) at which it is no longer visible. The collected data is given in the table below. Complete parts (a) through (c) below.
Observation
1
2
3
4
Date
1/25 3/19
5/30
7/3
9/13
11/7
Initial Depth, X;
41.2
41.4 74.2
47.3
56.9 37.6
Depth Five Years Later, Y;
50.0
41.0 80.1
50.2
62.0
40.5
a) Why is it important to take the measurements on the same date?
O A. Using the same dates makes it easier to remember to take samples
O B. Using the same dates maximizes the difference in water clarity.
C. Using the same dates makes the second sample dependent on the first and reduces variability in water clarity attributable to date.
O D. Those are the same dates that all biologists use to take water clarity samples.
b) Does the evidence suggest that the clarity of the lake is improving at the a = 0.05 level of significance? Note that the normal probability plot and boxplot of the data indicate that the differences are approximately normally distributed with no outliers.
Let d, = X, - Y, Identify the null and alternative hypotheses.
Ho: Hd
H;: Pa
(Type integers or decimals. Do not round.)
Determine the test statistic for this hypothesis test.
- 3.27
(Round to two decimal places as needed.)
Find the P-value for this hypothesis test.
P-value =
- 0.07
(Round to three decimal places as needed.)
What is your conclusion regarding H,?
O A. Reject Ho. There is not sufficient evidence at the a = 0.05 level of significance to conclude that the clarity of the lake is improving.
O B. Do not reject Ho. There is not sufficient evidence at the a= 0.05 level of significance to conclude that the clarity of the lake is improving.
OC. Do not reject Hp. There is sufficient evidence at the a= 0.05 level of significance to conclude that the clarity of the lake is improving.
O D. Reject Ho- There is sufficient evidence at the a = 0.05 level of significance to conclude that the clarity of the lake is improving.
c) Draw a boxplot of the differenced data. Does this visual evidence support the results obtained in part b)?
Choose the correct graph below.
O A.
OB.
OC.
OD.
Difference
Difference
Difference
Difference
Does this visual evidence support the results obtained in part b)?
O A. Yes because the boxplot supports that the lake is becoming more clear, since most differences are negative.
O B. No because the boxplot supports that the lake is not becoming more clear, since most differences are negative.
OC. No because the boxplot supports that the lake is not becoming more clear, since most differences are positive or near 0.
O D. Yes because the boxplot supports that the lake is becoming more clear, since most differences are positive or near 0.
YOU ANSWERED: - 0.07
Expert Solution
This question has been solved!
Explore an expertly crafted, step-by-step solution for a thorough understanding of key concepts.

Step by step
Solved in 2 steps with 1 images

Recommended textbooks for you
Holt Mcdougal Larson Pre-algebra: Student Edition…
Algebra
ISBN:
9780547587776
Author:
HOLT MCDOUGAL
Publisher:
HOLT MCDOUGAL

Algebra & Trigonometry with Analytic Geometry
Algebra
ISBN:
9781133382119
Author:
Swokowski
Publisher:
Cengage

Glencoe Algebra 1, Student Edition, 9780079039897…
Algebra
ISBN:
9780079039897
Author:
Carter
Publisher:
McGraw Hill
Holt Mcdougal Larson Pre-algebra: Student Edition…
Algebra
ISBN:
9780547587776
Author:
HOLT MCDOUGAL
Publisher:
HOLT MCDOUGAL
Algebra & Trigonometry with Analytic Geometry
Algebra
ISBN:
9781133382119
Author:
Swokowski
Publisher:
Cengage
Glencoe Algebra 1, Student Edition, 9780079039897…
Algebra
ISBN:
9780079039897
Author:
Carter
Publisher:
McGraw Hill