1.0 Assume the risk-free rate is 4%. Calculate the stock's expected return, standard deviation, coefficient of variation, and Sharpe ratio. Do not round intermediate calculations. Round your answers to two decimal plac Stock's expected return: Standard deviation: Coefficient of variation: Sharpe ratio:
1.0 Assume the risk-free rate is 4%. Calculate the stock's expected return, standard deviation, coefficient of variation, and Sharpe ratio. Do not round intermediate calculations. Round your answers to two decimal plac Stock's expected return: Standard deviation: Coefficient of variation: Sharpe ratio:

MATLAB: An Introduction with Applications
6th Edition
ISBN:9781119256830
Author:Amos Gilat
Publisher:Amos Gilat
Chapter1: Starting With Matlab
Section: Chapter Questions
Problem 1P

Related questions
Question
100%
Transcribed Image Text:Check My Work
еВook
Problem Walk-Through
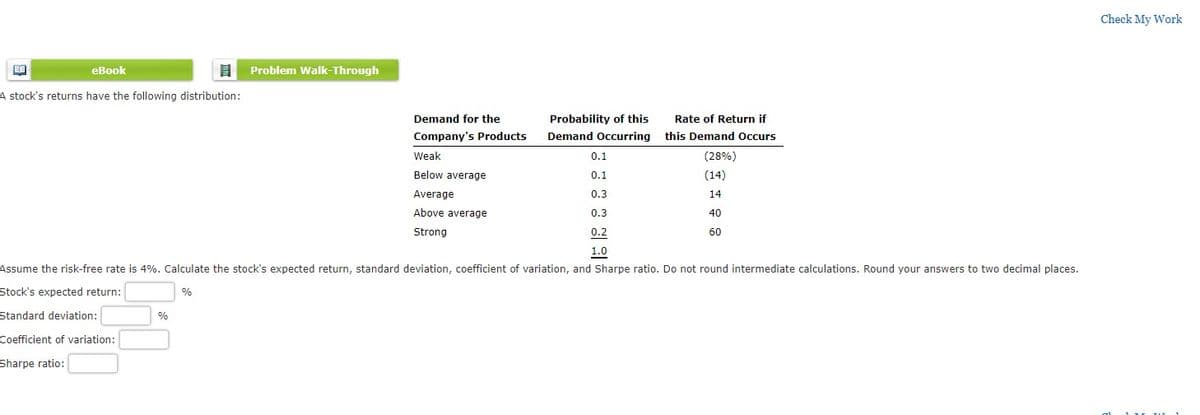
A stock's returns have the following distribution:
Demand for the
Probability of this
Rate of Return if
Company's Products
Demand Occurring this Demand Occurs
Weak
0.1
(28%)
Below average
0.1
(14)
Average
0.3
14
Above average
0.3
40
Strong
0.2
60
1.0
Assume the risk-free rate is 4%. Calculate the stock's expected return, standard deviation, coefficient of variation, and Sharpe ratio. Do not round intermediate calculations. Round your answers to two decimal places.
Stock's expected return:
%
Standard deviation:
%
Coefficient of variation:
Sharpe ratio:
Expert Solution
This question has been solved!
Explore an expertly crafted, step-by-step solution for a thorough understanding of key concepts.

This is a popular solution!

Trending now
This is a popular solution!

Step by step
Solved in 2 steps with 2 images

Recommended textbooks for you
MATLAB: An Introduction with Applications
Statistics
ISBN:
9781119256830
Author:
Amos Gilat
Publisher:
John Wiley & Sons Inc

Probability and Statistics for Engineering and th…
Statistics
ISBN:
9781305251809
Author:
Jay L. Devore
Publisher:
Cengage Learning

Statistics for The Behavioral Sciences (MindTap C…
Statistics
ISBN:
9781305504912
Author:
Frederick J Gravetter, Larry B. Wallnau
Publisher:
Cengage Learning
MATLAB: An Introduction with Applications
Statistics
ISBN:
9781119256830
Author:
Amos Gilat
Publisher:
John Wiley & Sons Inc
Probability and Statistics for Engineering and th…
Statistics
ISBN:
9781305251809
Author:
Jay L. Devore
Publisher:
Cengage Learning
Statistics for The Behavioral Sciences (MindTap C…
Statistics
ISBN:
9781305504912
Author:
Frederick J Gravetter, Larry B. Wallnau
Publisher:
Cengage Learning

Elementary Statistics: Picturing the World (7th E…
Statistics
ISBN:
9780134683416
Author:
Ron Larson, Betsy Farber
Publisher:
PEARSON

The Basic Practice of Statistics
Statistics
ISBN:
9781319042578
Author:
David S. Moore, William I. Notz, Michael A. Fligner
Publisher:
W. H. Freeman

Introduction to the Practice of Statistics
Statistics
ISBN:
9781319013387
Author:
David S. Moore, George P. McCabe, Bruce A. Craig
Publisher:
W. H. Freeman