he following data is given: 1 3 4 6. 9 12 14 y 4 5 6. 7 9. 11 se linear least-squares regression to determine the coefficients m and b in the function y = m:
Q: The following data is on number of hours studied (x) (per week) and the final grade (y) (out of 100)…
A: Given data as ( x ) number of hours studied per week and the final grade ( y ). and also given that…
Q: Complete parts (a) through (c) below for the accompanying data set 4 6 7 y 4 7 8 10 (a) Determine…
A: From the given information, x y x^2 y^2 xy 4 3 16 9 12 5 4 25 16 20 6 7 36 49 42 7 8 49…
Q: The following data is given... x 1 2 3 5 8 y 0.8 1.9 2.2 3 3.5 Determine the coefficients m and b…
A: The linear equation is represented as y=a+bx. The least-squares regression technique uses a dataset…
Q: birth weights (in pounds), x, and the lengths (in inches), y, for a set of newborn babies at a local…
A: NOTE:The data set is as follows; Birth Weight (in Pounds), x-12,10,88,11,11,33,55,44,77,66…
Q: Q4// Evaluate the coefficient a, b from the below data using least square regression method, then…
A:
Q: Find the equation of the multiple regression plane of Z on X and Y from the following data. X : 30…
A: Step-by-step procedure to find the multiple regression plane of Z on X and Y using Excel: In Excel…
Q: The following data was taken from experiment. The data can be modeled by the following equation. ya…
A: image is attached
Q: Compute the least-squares regression equation for the given data set. Use a TI-84 calculator. Round…
A: The independent variable is x. The dependent variable is y. This is simple linear regression model.…
Q: The following data is given: x -7 -4 -1 0 2 5 7 y 20 14 5 3 -2 -10 -15 Use linear…
A: Given , x -7 -4 -1 0 2 5 7 y 20 14 5 3 -2 -10 -15
Q: Use the gi ven data to find the equation of the regression line. Round the final values to three…
A:
Q: The following data represents the rate of return of the stock exchange (x) and the rate of return of…
A: Using Excel > Data > Data analysis > Regression, we get following output table:
Q: Suppose the line y=D4x+1 is used to fit the data point below. Calculate the Least Squares Error E.…
A:
Q: The data below are the temperatures on randomly chosen days during a summer class and the number of…
A: Given data is Temperature x 72 85 91 90 88 98 75 100 80 No. of absences y 3 7 10 10 8 15 4 15 5
Q: X y 2. Use the least squares regression to fit a straight line to 0 2 6 9 5 6 6 9 4 7 11 8 12 8 15…
A: MATLAB CODE: INPUT clcclearx=[0 2 4 6 9 11 12 15 17 19]y=[5 6 7 6 9 8 8 10 12…
Q: The following data x 1 20 30 y 1 400 800 1300 is regressed with least squares 40 regression to (y =…
A: given data x 1 20 30 40 y 1 400 800 1300 claim- what is the value of a1
Q: H.W Find the regression line equation using the least squares method of the following data, which…
A: Given data is Income X 35 49 21 39 15 28 25 ∑x = 212 Food expenditure 9 15 7 11 5 8 9 ∑ y=64
Q: The following data is given: 1 3 4 9. 12 14 y 2 4 5 7 9 11 Use linear least-squares regression to…
A:
Q: Consider the following table of data 1 2 6. 7. 8. 9. y 32 30 28 25 16 13 10 9. By using least…
A:
Q: The following data represents the rate of return of the stock exchange (x) and the rate of return of…
A: The regression is given by, y-hat = 0.9764 x + 0.5975 standard error of the estimate, se(y-hat) =…
Q: Find the curve of best fit of the type y = a = ae" - aeox to the following data by the method of…
A:
Q: Given are five observations for two variables, x and y. x 1 2 3 4 5 y 3 7 7 10 15 The…
A:
Q: Consider the following data. 21 6. 12 30 55 10.5 20.4 31.3 38.6 75.9 118.8 (a) Find a linear model.…
A: Given that the data are x 2 5 9 12 30 55 y 10.5 20.4 31.3 38.6 75.9…
Q: A statistician wishes to examine the relationship between average monthly rainfall (in mm), x, and…
A: The formula to find a and b is:
Q: The following data show the height h, in inches, and weight w, in pounds, of an average adult male.…
A: Let the power model for weight versus height be; w=ahbBy applying logarithm we can transfrom the…
Q: Q.1) a) Use least-squares regression to fit a straight line to 11 6 7 6 9 x | 0 4 6 12 15 17 19 y 8…
A: Given: The provided data is: x 0 2 4 6 9 11 12 15 17 19 y 5 6 7 6 9 8 7 10 12 12 The number…
Q: Consider the bivariate data set with n = 7 observations X 1 7 -5 2 7 5 4 Y 35 77 13 22 69 69 59…
A: The independent variable is X. The dependent variable is Y. This is simple linear regression model.…
Q: Fit a least squares quadratic curve to the following data and estimate Y at X = 2.4 1 2 3 4 Y 1.7…
A:
Q: Ах Obtain the values for A and B by fitting the equation y = to the following data using B+x linear…
A: Consider the given function and table. y=AxB+x And,
Q: ind the slope m for the least-squares regression line. x y 5 8 9 10 11 13 17 19
A:
Q: Q4// Evaluate the coefficient a, b from the below data using least square regression method, then…
A:
Q: Consider the following data. x 2|5 | 9 | 12 y 10.2 20.0 | 30.7 | 37.9 75.1 117.8 30 55 (a) Find a…
A: Given information: Given data represents the values of the variables x and y.
Q: The following experimental data points are to be fitted to this 3-model parameter equation: In(y) =…
A: Given: The parameter equation is ln(y) = a - b(x + c)-1 and x -16 -6 11 34 65 y 10 20 60 200…
Q: The following data are the average annual repair cost (in O.R.) and the age of automobiles ( in…
A: In this case car age (x) the independent variable and repair cost (y) is the dependent variable.
Q: For each data set below a. Draw a scattergram and a freehand regres- sion line. b. Compute the slope…
A:
Q: 6. The residual for the least-squares regression line y = 3.422 +5.551x at the data point (9.227, y)…
A:
Q: Estimate a , b of regression line for the following data: O = 10, Ex; = 2817.9, Ey; = 1574.8 Ex;y; =…
A: Formula Used: Equation of regression line is; Y = a + bX Where a is intercept b is slope Slope b =…
Q: For the following simple linear regression equation y = 2Bo + B1VX find the estimated parameters…
A: The regression is a method of machine learning under subgroup Supervised Learning. The regression…
Q: The following data is given: 3 4 14 12 9 _y 4 7 11 Use linear least-squares regression to determine…
A:
Q: The following data represent the commute time (in minutes) x and a score on a well-being survey y.…
A: Solution
Q: Find the equation of the least squares regression line of y on x, for the following sets of data:…
A:
Q: The following data are the average annual repair cost (in O.R.) and the age of automobiles ( in…
A: From the provided information, The regression equation can be obtained using excel steps as follow:…
Q: Q5/ A: Use Linear Regression to fit the following experimental data X 3 2 3 1 6 Y 1 2 10 9 8 05 5 10
A:
Q: 1. The following data is given: 2 5 8 9 13 15 y 7 8 10 11 12 14 15 Use linear least-squares…
A: Note- Since you have posted multiple questions, as per our guidelines we are supposed to answer only…
Q: Compute the least-squares regression equation for the given data set. Use a TI-84 calculator. Round…
A: The independent variable is x. The dependent variable is y. We have to compute the least squares…
Q: Complete Table 3 and find the values of A and B for the straight line that provides the best…
A: From the given information, The provided data can be shown in the below table; x y 1 2 2 3…
Q: The following data x 1 20 30 40 1 400 800 1300 is regressed with least squares regression to y = a,…
A: Given: x y 1 1 20 400 30 800 40 1300
Q: d. Draw the regression line on the scatter diagram using the yp points.e. Find y for x = 50 x 20…
A: Given data x y 20 20 10 20 30 30 40 50 60 60 70 80…
Q: Use the following data for parts (a) through (e). x 5 7 3 16 12 9 y 8 9 11 27 15 13…
A:
Numerical Solutions
can you help me by minimizing the equation
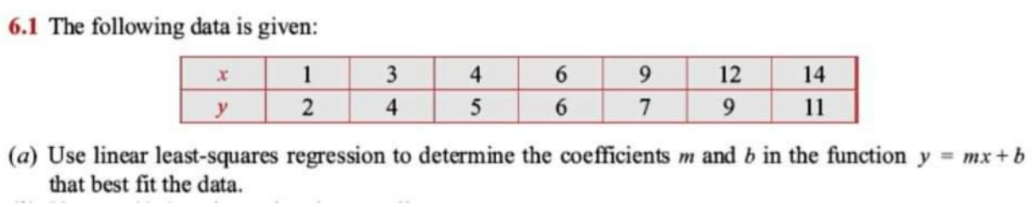
Step by step
Solved in 2 steps
- The following fictitious table shows kryptonite price, in dollar per gram, t years after 2006. t= Years since 2006 0 1 2 3 4 5 6 7 8 9 10 K= Price 56 51 50 55 58 52 45 43 44 48 51 Make a quartic model of these data. Round the regression parameters to two decimal places.The following estimated regression equation is based on 10 observations yhat = 30.12 + .60x1 + .48x2 SST = 680.3, SSR= 601.4, Sb1 = .0813 and Sb2 = .0567 a. Compute MSR and MSE b. Compute F and perform the appropriate F test. Use alpha = .05. c. Perform a t test for the significance of B1. Use alpha = .05. d. Perform a t test for the significance of B2. Use alpha = .05.The following information pertains to a simple least squares regression for DEF Corporation: Mean value of the dependent variable 30Mean value of the independent variable 8Coefficient of the independent variable 3Number of observations 12 What is the "a" value for the leasts-quares regression model? a. 60b. 30c. 6d. 0
- The following estimated regression equation is based on 10 observations y = 30.12 + .60x1 + .48x2 SST = 680.3, SSR= 601.4, Sb1 = .0813 and Sb2 = .0567 a. Compute MSR and MSE b. Compute F and perform the appropriate F test. Use alpha = .05. c. Perform a t test for the significance of B1. Use alpha = .05. d. Perform a t test for the significance of B2. Use alpha = .05.Consider the following correlations -0.9 , -0.5 , -0.2 , 0 , 0.2 , 0.5 and 0.9. For each give the fraction of the variation in y that is explained by the least-squares regression of y on x.Given are five observations for two variables, x and y. xi 3 8 12 18 20 yi 54 57 50 24 11 -select your answer choices- b. The least squares line provided an (good, bad) fit; __ % of the variability in y has been explained by the estimated regression equation (to 1 decimal)
- Suppose Wesley is a marine biologist who is interested in the relationship between the age and the size of male Dungeness crabs. Wesley collects data on 1,000 crabs and uses the data to develop the following least-squares regression line where ? is the age of the crab in months and ?ˆ is the predicted value of ?, the size of the male crab in cm. ?ˆ=8.1312+0.5226? What is the value of ?ˆ when a male crab is 23.0736 months old? Provide your answer with precision to two decimal places. ?ˆ = Interpret the value of ?. The value of ?ˆis the predicted size of a crab when it is 23.0736 months old. the predicted incremental increase in size for every increase in age by 23.0736 months. the predicted number of crabs out of the 1,000 crabs collected that will be 23.0736 months old. the probability that a crab will be 23.0736 months old.Suppose Wesley is a marine biologist who is interested in the relationship between the age and the size of male Dungeness crabs. Wesley collects data on 1,000 crabs and uses the data to develop the following least-squares regression line where ? is the age of the crab in months and ?̂ is the predicted value of ?, the size of the male crab in cm. ?̂=8.2052+0.5693? What is the value of ?̂ when a male crab is 21.7865 months old? Provide your answer with precision to two decimal place10. For the following data, compute the least squares regression line for predicting gpagiven SAT.SAT: 500 530 590 660 610 700 570 640gpa: 2.3 3.1 2.6 3.0 2.4 3.3 2.6 3.5
- Consider the following five data points: X -1 0 1 2 3 Y -1 1 2 4 5 a. Use regression analysis to calculate by hand the estimated coefficients of the equation Y = B + aX. b. Compute the standard error and the t-statistics for the coefficient of X.For the following data set: x 3.9 6.1 4.6 3.7 1.8 3.3 3.4 y 4.2 4.7 5.7 4.5 9.6 5.2 4.3 Part 1 of 4 (a) Compute the least-squares regression line. Round the answers to at least four decimal places. Regression line equation: =y .In a study measuring the relationship between height in centimeters and annual income in dollars, it has been determined that for Group 1, r2 =0.15 and for Group 2, r2 =0.10 where r denotes the correlation between the two variables. Least-squares regression lines are fitted to the observations from each group. Which of the following statement is true: A. There could be a positive relationship between the two variables for Group 1 and a negative relationship between the two variables for Group 2 B. The sum of the residuals for Group 1 is greater than the sum of the residuals for Group 2. C. Measuring the height in inches would increase the value of r2 for both groups. D. None of the answer options is true Can you also explain the difference between r and r2, and why least square regressions are used?