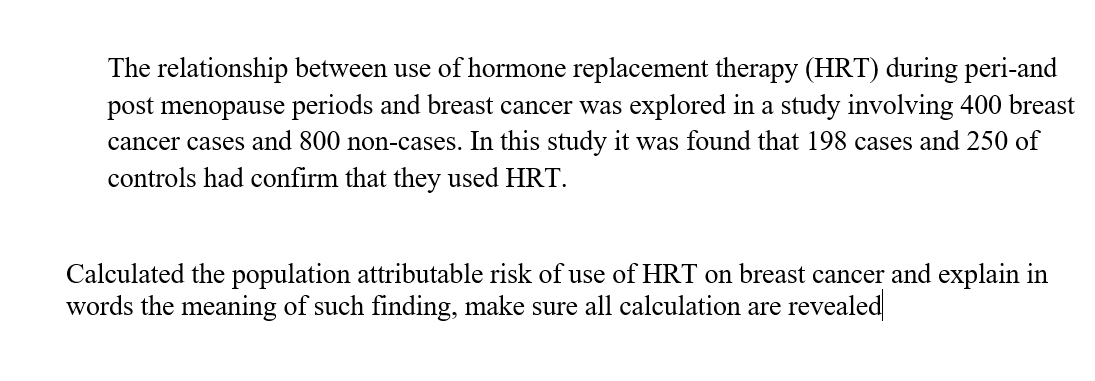
he population attributable risk (refer to im


Q: Define statistics
A: .Statistics : It is a branch of applied mathematics and may be regarded as mathematics applied to…
Q: A team of engineers developed a device that measures the distance of a ship from the shore. The…
A: Let X be the Continuous random variable of distance of a ship from the store follows Normal…
Q: Incidence reflects the likelihood of developing a disease among a group of participants free of the…
A: Incidence refers to the proportion of number of new cases among people who are free from disease for…
Q: Sample mean is always an estimator of the population mean, thus we use the degrees of freedom to…
A: Given that Sample mean is always an estimator of the population mean, thus we use the degrees of…
Q: How many standard deviations is the score from the sample mean Study 1 Scale range- 35(highest score…
A:
Q: CHI-SQUARED Be able to calculate each chi-square Know how to determine the expected data Know how…
A: The chi square test is used to find whether there is an association between the categorical…
Q: Literacy Rates For the same countries used in Exer- cise 22, the literacy rates (in percents) for…
A: Obtain the least squares equation: A simple regression equation describes the effect of predictor…
Q: The expected value of an accountant's profit and loss analysis is 0. Explain what this means
A: The expected value of an accountant's profit and loss analysis is 0. This means he will not either…
Q: Cosh Test
A: To test the convergence of cosnnn=1∞ For all real valued x, it is known that -1≤cosx≤1. Therefore,…
Q: mean price in each city.
A: The GIven data is The Department of trade and industry survey of the Price of unleaded gasoline at…
Q: 56. Blood pressure According to a health informa- tion website, the distribution of adults'…
A: Given data Mean (µ) = 70 Standard deviation (σ) = 20 Probability of diastolic pressure above 100 is…
Q: What is an assumption made about the value of a population parameter called? conclusion O…
A: Population parameter is given.
Q: Look Back and Reflect Explain the usefulness of the Central Limit Theorem in solving problems…
A: As per the Bartleby guildlines we have to solve first question and rest can be reposted…
Q: Energy consumption for single family comes is a mean of 1050kw and standard deviation of 218kw. Find…
A: Given information- Population mean, μ = 1050 kw Population standard deviation, σ = 218 kw We have to…
Q: IQ scores for students at a prestigious university are normally distributed with a mean of 110 and a…
A:
Q: standard error.
A: a. The given information in Non-college Grades Y=2890 Average salariessY=520 standard…
Q: best measure of central tendancy
A: The measure of central tendency
Q: In point estimation, data from the population is used to estimate the population parameter O sample…
A: Statistic: Statistic may be defined as which one is based on sample. Parameter: which one is based…
Q: What is a chi-square distribution? Explain and give an example.
A: Chi-square is the distribution of a sum of squares independent standard normal random variables. If…
Q: What assumption regarding the population is necessary for making an interval estimate for the…
A: It is assumed that the population follows normal distribution with known population variance.
Q: Which measure(s) of central tendency is appropriate for a ratio variable? The median and mean are…
A: Solution-: Which measure(s) of central tendency is appropriate for a ratio variable? The median…
Q: population standard deviation. How large a sample would they need to take?
A:
Q: True or false. Using inferential statistics, it is commonly possible to say that you have 100%…
A: Inferential statistics: In inferential statistics, the data is collected from a sample and then…
Q: Find the proportion of cars with time of at least 208 minutes?show work 2.Find the time 40TH…
A: here ascending order of given time , 129, 130, 135, 135, 137, 138, 139, 144, 146, 146, 148, 149,…
Q: The entering SAT scores and high school GPA's of 100 first-year students and their grade point…
A: Given information: The investigator is specially interested to predict the college GPA for next…
Q: Mean (Average): 76 Population Standard Deviation, σ 19 Total Numbers, N 45 What score…
A:
Q: Find the sample size required to estimate the percentage of statistics students who take their…
A:
Q: II. Solve for the variance and standard deviation.
A: Here given discrete probability distribution table for variable x
Q: test statistic = p-value = i
A: Given that the sample size is n = 50 Sample proportion = 0.86
Q: Snowball sampling mean the study units that happen to be present at the time of data collection will…
A: In Snowball sampling, the existing individuals are considered as sample and they are asked to refer…
Q: Upholding academic integrity in online classes is a daunting challenge of faculty members of the…
A: “Since you have posted a question with multiple sub-parts, we will solve first two sub-parts for…
Q: Construct the marginal probability distribution of Y. What is the mean of X and Y .
A: The variable X is defined as unemployed and Y is defined as employed. The probability formula is,…
Q: If the number of samples taken is 35 what should you assume about the population? O Binomial…
A: Larger sample size means the distribution of results should approach a normal bell-shaped curve. The…
Q: MA In order to compare same variables having same units, one should use: Range Coefficient of…
A: Solution In order to compare same variables having same units,
Q: 1. excel Solution 2. Ho and Ha 3. ANOVA TABLE
A: Given table :
Q: What is relative risk? Give an example of how it is interpreted
A:
Q: Mean sample is a 1) Parameter 2)Statistics 3) variable 4)Constant
A: Parameter: A statistical measure based on population values is called a Parameter, e.g. population…
Q: Mean (Average): 76 Population Standard Deviation, σ 19 Total Numbers, N 45 What score…
A: A \(z\)-score indicates the position of a data point in terms of its distance from the mean when…
Q: Determine whether the samples are dependent or independent The effectiveness of a new headache…
A: Given : The effectiveness of a new headache medicine is tested by measuring the amount of time…
Q: standard error
A: Standard error of the mean: The standard error of the mean is defined as the value of the standard…
Q: Null? test statistics? p value? conclusion for hypothesis
A:
Q: Describe the three measures of variability; the range, variance, and standard deviation. Explain…
A: In statistics, there are four measure of variability of distribution that measures the spread in the…
Q: The mean age of judges in Los Angeles is 48.6 years. Identify the null hypothesis and alternative…
A: null hypothesis H0 : μ=48.6Alternative hypothesis Ha : μ≠48.6
Q: Sample mean is always an estimator of the population mean, thus we use the degrees of freedom to…
A: Sample mean: It is the sum of the observations divided by the total number of observations of the…
Q: In estimation, data from the population is used to estimate the population parameters O the mean of…
A: Hey there! Thank you for posting the question. Since there are multiple questions posted, we will…
Q: Mean of sampling distribution of means Standard deviation of the sampling distribution of means
A: We have given that data 3 ,7, 11 , 15 Sample size n =4 I want to find standard deviation of the…
Q: test statistic p-value = i
A: For group A, sample size n1 = 8, sample mean = 125 and sample SD = 18 For group B, sample size n2 =…
Q: Calculate b0 value and Mean Absolute Error!
A: Multiple regression is a statistical technique that can be used to analyze the relationship between…
Q: Standard Error of the mean used to estimate the population mean, and to estimate differences between…
A:
Q: How do I find the population mean (not the sample mean) in order to solve for t? (Second page)
A: Hypothesis testing uses data from a sample to draw conclusions about a pop.
Calculated the population attributable risk (refer to image)

Step by step
Solved in 2 steps


- Rosner analyzed data from children who lived near a lead smelter (which is a facility that uses extreme heat to extract the metal lead from lead ore) in El Paso, Texas, and reported that out of 124 children studied, 23 developed colic (which is a pattern of fussiness and crying for no apparent reason). Suppose that in the state of Taxes in general at the time (early 1980s), the rate of colic in children was 16.0%. Follow the steps for testing whether the proportion of children developing clico was significantly different for the 124 children living near the lead smelter than for Taxes children in general (16%). Use alpha level of 0.03 a. Identify the null hypothesis for this statistical test. b. Identify the alternative hypotheses for this statistical test. c. Explain: Why should this be a two-tailed test, the way I have described it? d. calculate the sample proportion p̂, rounded to three decimal places. e. Calculate the appropriate test statistic, show all work. f. Based on…How does the answer to this question differ from the method used to find the difference of variability for the same data? (At the 0.05 level of significance, is there evidence of a difference in the variability of the computer anxiety experienced by males and females?) vs. (is there evidence of a significant difference in the average computer anxiety experienced by males and females.) Are both of these questions answered the same way, using the same formulas and method?A group of 10-year-old boys were first ascertained in a camp for diabetic boys. They had their weight measured at baseline and again when they returned to camp 1 year later. Each time, a serum sample was obtained from which a determination of hemoglobin A1c (HgbA1c) was made. HgbA1c (also called glycosylated hemoglobin) is routinely used to monitor compliance with taking insulin injections. Usually, the poorer the compliance, the higher the HgbA1c level will be. The hypothesis is that the level HgbA1c is related to weight. The data in Table 11.28 were obtained. 11.92 What test can be performed to assess the relationship between weight and HgbA1c at the initial visit? 11.93 Please perform the test in Problem 11.92, and report a two-tailed p-value. 11.94 Do the results in Problem 11.93 imply a relationship between change in HgbA1c and change in weight for an individual boy? Why or why not?
- A group of 10-year-old boys were first ascertained in a camp for diabetic boys. They had their weight measured at baseline and again when they returned to camp 1 year later. Each time, a serum sample was obtained from which a determination of hemoglobin A1c (HgbA1c) was made. HgbA1c (also called glycosylated hemoglobin) is routinely used to monitor compliance with taking insulin injections. Usually, the poorer the compliance, the higher the HgbA1c level will be. The hypothesis is that the level HgbA1c is related to weight. The data in Table 11.28 were obtained. 11.95 Compute a rank correlation between change in weight and change in HgbA1c, each over 1 year. Use this measure to directly test the hypothesis that change in weight over 1 year is related to change in HgbA1c. Report a two-tailed p-value, and provide a 95% confidence interval for the underlying rank correlation.A group of 10-year-old boys were first ascertained in a camp for diabetic boys. They had their weight measured at baseline and again when they returned to camp 1 year later. Each time, a serum sample was obtained from which a determination of hemoglobin A1c (HgbA1c) was made. HgbA1c (also called glycosylated hemoglobin) is routinely used to monitor compliance with taking insulin injections. Usually, the poorer the compliance, the higher the HgbA1c level will be. The hypothesis is that the level HgbA1c is related to weight. The data in Table 11.28 were obtained.11.92 What test can be performed to assess the relationship between weight and HgbA1c at the initial visit?11.93 Please perform the test in Problem 11.92, and report a two-tailed p-value.11.94 Do the results in Problem 11.93 imply a relationship between change in HgbA1c and change in weight for an individual boy? Why or why not?11.95 Compute a rank correlation between change in weight and change in HgbA1c, each over 1 year. Use…