he table shows the number of cellular phone subscribers (In millions) in the United States for selected years. f Year 1990 1993 1996 1999 2002 2005 86 141 206 Number 5 16 44 (a) Use the regression capabilities of a graphing utility to find a mathematical model of the form y at + bt + c for the data. In the model, y rem (Round your coefficients to three decimal places.) y%3D (b) Use a graphing utility to plot the data and graph the model. 350 350 300 300 250 250 200 200 150 150 100 100 50 50 468 10 12 14 16 18 20 8 10 12 14 16 18 20 350 350 300 300 250 250 200 y 200 150 150 100 100 50 50 1995 2000 2005 2010 01990 1996 2000 2005 2010 (c) Use the model to predict the number of cellular phone subscribers in the United States in the vear 2011 Need Help? Resd Watch
he table shows the number of cellular phone subscribers (In millions) in the United States for selected years. f Year 1990 1993 1996 1999 2002 2005 86 141 206 Number 5 16 44 (a) Use the regression capabilities of a graphing utility to find a mathematical model of the form y at + bt + c for the data. In the model, y rem (Round your coefficients to three decimal places.) y%3D (b) Use a graphing utility to plot the data and graph the model. 350 350 300 300 250 250 200 200 150 150 100 100 50 50 468 10 12 14 16 18 20 8 10 12 14 16 18 20 350 350 300 300 250 250 200 y 200 150 150 100 100 50 50 1995 2000 2005 2010 01990 1996 2000 2005 2010 (c) Use the model to predict the number of cellular phone subscribers in the United States in the vear 2011 Need Help? Resd Watch

Algebra & Trigonometry with Analytic Geometry
13th Edition
ISBN:9781133382119
Author:Swokowski
Publisher:Swokowski
Chapter2: Equations And Inequalities
Section2.7: More On Inequalities
Problem 44E

Related questions

Question
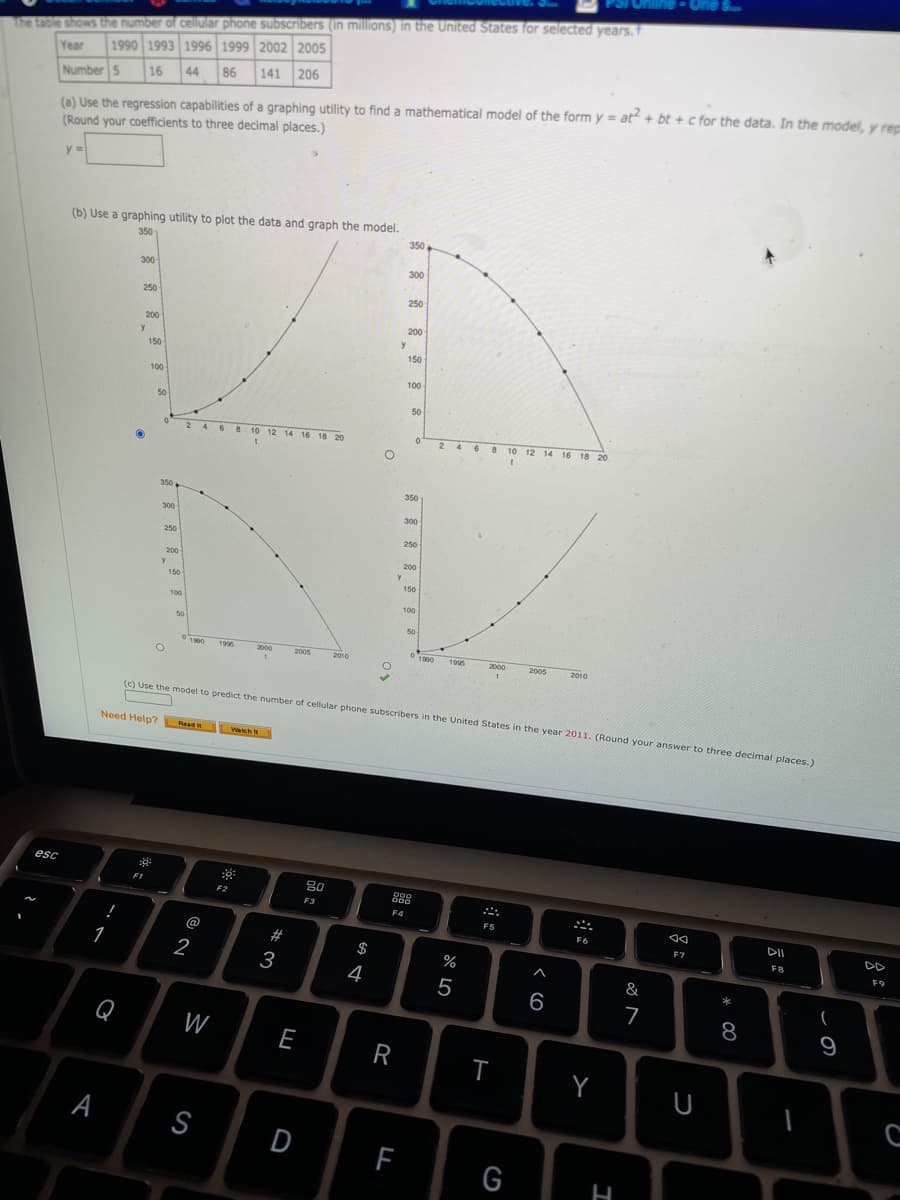
Transcribed Image Text:The table shows the number of cellular phone subscribers (in millions) in the United States for selected vears,
Year
1990 1993 1996 1999 2002 2005
(a) Use the regression capabilities of a graphing utility to find a mathematical model of the form y = at + bt + c for the data. In the model, y rep
(Round your coefficients to three decimal places.)
44
86
141 206
16
Number 5
y =
(b) Use a graphing utility to plot the data and graph the model.
350
350
300
300
250
250
200
200
150
150
100
100
50
50
2 46 8 10 12 14 16 18 20
24 6
10 12 14 16 18 20
350
350
300
300
250
250
200
200
y
150
150
100
100
50
50
1996
2000
2005
2010
1995
2000
2005
2010
(c) Use the model to predict the number of cellular phone subscribers in the United States in the vear 2011. (Round your answer to three decimal places.)
Need Help? Raad Wach
esc
80
888
ET
F2
F3
F5
DII
F6
DD
!
F7
F8
@
#3
F9
1
$
%
2
3
4
&
5
6
7
8
Q
W
E
R
T
Y
S
D
F
G
* 00
A
Expert Solution
This question has been solved!
Explore an expertly crafted, step-by-step solution for a thorough understanding of key concepts.

This is a popular solution!

Trending now
This is a popular solution!

Step by step
Solved in 2 steps with 2 images

Knowledge Booster


Learn more about
Need a deep-dive on the concept behind this application? Look no further. Learn more about this topic, calculus and related others by exploring similar questions and additional content below.Recommended textbooks for you
Algebra & Trigonometry with Analytic Geometry
Algebra
ISBN:
9781133382119
Author:
Swokowski
Publisher:
Cengage
Algebra & Trigonometry with Analytic Geometry
Algebra
ISBN:
9781133382119
Author:
Swokowski
Publisher:
Cengage