Heights of females follow a normal distribution with mean 64.5 inches in the United States. (a) You take a sample of 15 female students at UNC and observe the sample mean of heights to be 65.73 inches and the sample standard deviation to be 2.5 inches. Is this strong enough evidence that the average height of female students at UNC is higher than national average? (I) State the hypothesis. Ο H0: μ=64.5, Ha: μ+ 64.5 Ο Ho: μΕ64.5, Ha: μ< 64.5 Ο Hρ: μ-64.5, Ha: μ > 64.5 (II) Compute the test statistic. (Answer to two decimal places) t = (III) Compute the p-value. (Answer to four decimals) (IV) State your conclusion at the 5% significance level. O Reject Ho O Fail to reject Ho
Heights of females follow a normal distribution with mean 64.5 inches in the United States. (a) You take a sample of 15 female students at UNC and observe the sample mean of heights to be 65.73 inches and the sample standard deviation to be 2.5 inches. Is this strong enough evidence that the average height of female students at UNC is higher than national average? (I) State the hypothesis. Ο H0: μ=64.5, Ha: μ+ 64.5 Ο Ho: μΕ64.5, Ha: μ< 64.5 Ο Hρ: μ-64.5, Ha: μ > 64.5 (II) Compute the test statistic. (Answer to two decimal places) t = (III) Compute the p-value. (Answer to four decimals) (IV) State your conclusion at the 5% significance level. O Reject Ho O Fail to reject Ho

MATLAB: An Introduction with Applications
6th Edition
ISBN:9781119256830
Author:Amos Gilat
Publisher:Amos Gilat
Chapter1: Starting With Matlab
Section: Chapter Questions
Problem 1P

Related questions

Question
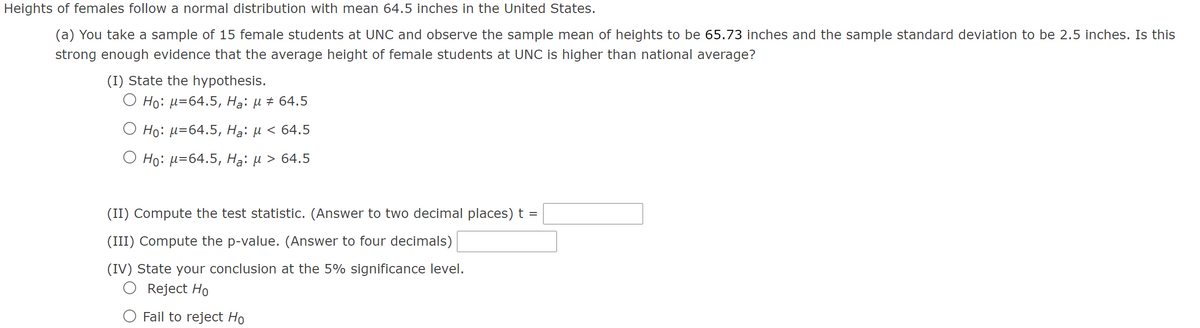
Transcribed Image Text:Heights of females follow a normal distribution with mean 64.5 inches in the United States.
(a) You take a sample of 15 female students at UNC and observe the sample mean of heights to be 65.73 inches and the sample standard deviation to be 2.5 inches. Is this
strong enough evidence that the average height of female students at UNC is higher than national average?
(I) State the hypothesis.
О Но: и-64.5, На: и # 64.5
O Ho: µ=64.5, Hạ: µ < 64.5
О Но: и-64.5, Hа: и > 64.5
(II) Compute the test statistic. (Answer to two decimal places) t =
(III) Compute the p-value. (Answer to four decimals)
(IV) State your conclusion at the 5% significance level.
Reject Ho
O Fail to reject Ho
Expert Solution
This question has been solved!
Explore an expertly crafted, step-by-step solution for a thorough understanding of key concepts.

Step by step
Solved in 2 steps with 1 images

Knowledge Booster


Learn more about
Need a deep-dive on the concept behind this application? Look no further. Learn more about this topic, statistics and related others by exploring similar questions and additional content below.Recommended textbooks for you
MATLAB: An Introduction with Applications
Statistics
ISBN:
9781119256830
Author:
Amos Gilat
Publisher:
John Wiley & Sons Inc

Probability and Statistics for Engineering and th…
Statistics
ISBN:
9781305251809
Author:
Jay L. Devore
Publisher:
Cengage Learning

Statistics for The Behavioral Sciences (MindTap C…
Statistics
ISBN:
9781305504912
Author:
Frederick J Gravetter, Larry B. Wallnau
Publisher:
Cengage Learning
MATLAB: An Introduction with Applications
Statistics
ISBN:
9781119256830
Author:
Amos Gilat
Publisher:
John Wiley & Sons Inc
Probability and Statistics for Engineering and th…
Statistics
ISBN:
9781305251809
Author:
Jay L. Devore
Publisher:
Cengage Learning
Statistics for The Behavioral Sciences (MindTap C…
Statistics
ISBN:
9781305504912
Author:
Frederick J Gravetter, Larry B. Wallnau
Publisher:
Cengage Learning

Elementary Statistics: Picturing the World (7th E…
Statistics
ISBN:
9780134683416
Author:
Ron Larson, Betsy Farber
Publisher:
PEARSON

The Basic Practice of Statistics
Statistics
ISBN:
9781319042578
Author:
David S. Moore, William I. Notz, Michael A. Fligner
Publisher:
W. H. Freeman

Introduction to the Practice of Statistics
Statistics
ISBN:
9781319013387
Author:
David S. Moore, George P. McCabe, Bruce A. Craig
Publisher:
W. H. Freeman