Hello Company makes three different products. Due to the constraints of their manufacturing equipment and warehouse facility, the company is only able to produce, store, and sell a total of 50,000 units each month. The production of Products A and B varies each month; however, Product C is a special order for one customer who purchases the same number of units every month. Pete Davila, the CEO, has provided the following data from last month for each product. Income Statement Product A Product B Product C Max Capacity Units 43,000 10.00 $ 3.00 $ 20,000 $ 5,000 8.00 $ 2.00 $ 2,000 50,000 Price per unit Variable expense per unit Total Fixed Costs 50.00 $ 15.00 $ 10,000 20.00 $ 40,000 $ Product Sales $ 40,000 $ 100,000 $ (30,000) 70,000 $ (10,000) 60,000 $ 430,000 $ 570,000 Variable Costs (129,000) $ (10,000) 30,000 $ (40,000) (10,000) (169,000) 401,000 301,000 $ (20,000) 281,000 Contribution Margin Fixed Costs (70,000) 331,000 Operating income (loss) Required Using the Data Table What-If Analysis tool in Excel, determine the Units and Operating Income (Loss) for each product based on the following scenarios. (Hint: Don't forget that the warehouse can only hold up to 50,000 units.) Scenario 1: Pete wants to find the mix of units that will result in the highest overall Operating Income, perform this analysis using a two-variable data table. Product A can vary between 40,000 units and a maximum of 45,000 units. Product B can vary between 3,000 units and a maximum of 8,000 units. Both Products A and B are manufactured in 1,000-unit increments. The production level of Product C is the same each month at 2,000 units. SCENARIO 1 Product A Product B Product C Operating Income (Loss) 331,000 43,000 43,000 43,000 Units 43,000 $ 5,000 $ 2,000 $ 50,000 $ %24
Hello Company makes three different products. Due to the constraints of their manufacturing equipment and warehouse facility, the company is only able to produce, store, and sell a total of 50,000 units each month. The production of Products A and B varies each month; however, Product C is a special order for one customer who purchases the same number of units every month. Pete Davila, the CEO, has provided the following data from last month for each product. Income Statement Product A Product B Product C Max Capacity Units 43,000 10.00 $ 3.00 $ 20,000 $ 5,000 8.00 $ 2.00 $ 2,000 50,000 Price per unit Variable expense per unit Total Fixed Costs 50.00 $ 15.00 $ 10,000 20.00 $ 40,000 $ Product Sales $ 40,000 $ 100,000 $ (30,000) 70,000 $ (10,000) 60,000 $ 430,000 $ 570,000 Variable Costs (129,000) $ (10,000) 30,000 $ (40,000) (10,000) (169,000) 401,000 301,000 $ (20,000) 281,000 Contribution Margin Fixed Costs (70,000) 331,000 Operating income (loss) Required Using the Data Table What-If Analysis tool in Excel, determine the Units and Operating Income (Loss) for each product based on the following scenarios. (Hint: Don't forget that the warehouse can only hold up to 50,000 units.) Scenario 1: Pete wants to find the mix of units that will result in the highest overall Operating Income, perform this analysis using a two-variable data table. Product A can vary between 40,000 units and a maximum of 45,000 units. Product B can vary between 3,000 units and a maximum of 8,000 units. Both Products A and B are manufactured in 1,000-unit increments. The production level of Product C is the same each month at 2,000 units. SCENARIO 1 Product A Product B Product C Operating Income (Loss) 331,000 43,000 43,000 43,000 Units 43,000 $ 5,000 $ 2,000 $ 50,000 $ %24

Cornerstones of Cost Management (Cornerstones Series)
4th Edition
ISBN:9781305970663
Author:Don R. Hansen, Maryanne M. Mowen
Publisher:Don R. Hansen, Maryanne M. Mowen
Chapter18: Pricing And Profitability Analysis
Section: Chapter Questions
Problem 26P

Related questions
Question
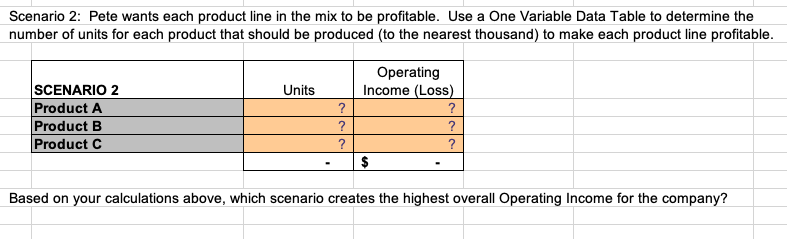
Transcribed Image Text:Scenario 2: Pete wants each product line in the mix to be profitable. Use a One Variable Data Table to determine the
number of units for each product that should be produced (to the nearest thousand) to make each product line profitable.
Operating
Income (Loss)
SCENARIO 2
Product A
Product B
Product C
Units
?
?
?
Based on your calculations above, which scenario creates the highest overall Operating Income for the company?
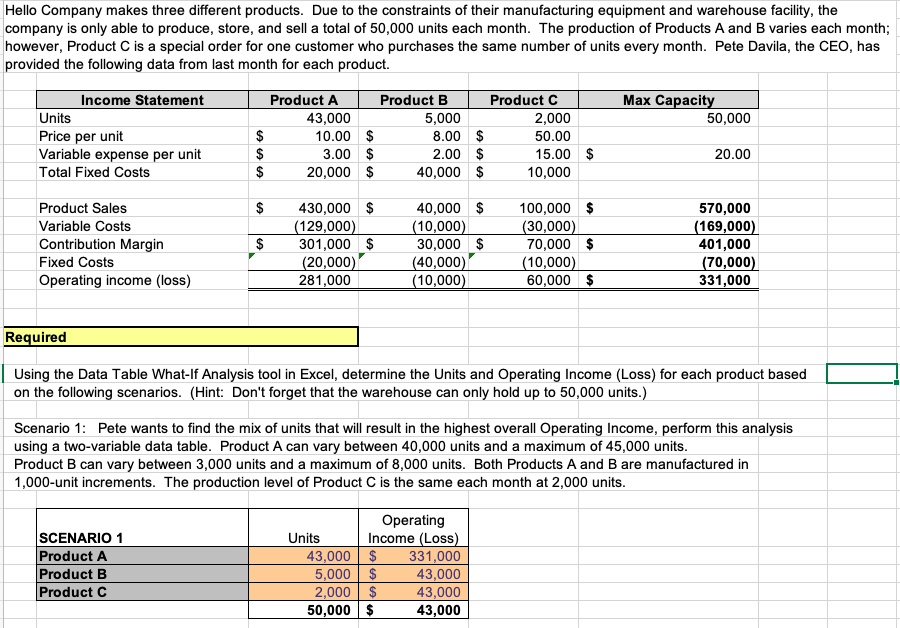
Transcribed Image Text:Hello Company makes three different products. Due to the constraints of their manufacturing equipment and warehouse facility, the
company is only able to produce, store, and sell a total of 50,000 units each month. The production of Products A and B varies each month;
however, Product C is a special order for one customer who purchases the same number of units every month. Pete Davila, the CEO, has
|provided the following data from last month for each product.
Income Statement
Product A
Product B
Product C
Мax Cарacity
5,000
8.00 $
2.00 $
Units
43,000
10.00 $
3.00 $
20,000 $
2,000
50,000
Price per unit
Variable expense per unit
$
$
$
50.00
15.00 $
20.00
Total Fixed Costs
40,000 $
10,000
Product Sales
$
430,000 $
40,000 $
100,000 $
570,000
(169,000)
401,000
(70,000)
331,000
Variable Costs
(129,000)
(10,000)
30,000 $
(30,000)
70,000 $
Contribution Margin
$
301,000 $
Fixed Costs
(20,000)
281,000
(40,000)
(10,000)
(10,000)
60,000 $
Operating income (loss)
Required
Using the Data Table What-If Analysis tool in Excel, determine the Units and Operating Income (Loss) for each product based
on the following scenarios. (Hint: Don't forget that the warehouse can only hold up to 50,000 units.)
Scenario 1: Pete wants to find the mix of units that will result in the highest overall Operating Income, perform this analysis
using a two-variable data table. Product A can vary between 40,000 units and a maximum of 45,000 units.
Product B can vary between 3,000 units and a maximum of 8,000 units. Both Products A and B are manufactured in
1,000-unit increments. The production level of Product C is the same each month at 2,000 units.
SCENARIO 1
Product A
Product B
Product C
Operating
Income (Loss)
331,000
43,000
43,000
Units
43,000 $
5,000 $
2,000 $
50,000 $
43,000
%24
Expert Solution
This question has been solved!
Explore an expertly crafted, step-by-step solution for a thorough understanding of key concepts.

This is a popular solution!

Trending now
This is a popular solution!

Step by step
Solved in 3 steps

Knowledge Booster


Learn more about
Need a deep-dive on the concept behind this application? Look no further. Learn more about this topic, accounting and related others by exploring similar questions and additional content below.Recommended textbooks for you
Cornerstones of Cost Management (Cornerstones Ser…
Accounting
ISBN:
9781305970663
Author:
Don R. Hansen, Maryanne M. Mowen
Publisher:
Cengage Learning

Managerial Accounting: The Cornerstone of Busines…
Accounting
ISBN:
9781337115773
Author:
Maryanne M. Mowen, Don R. Hansen, Dan L. Heitger
Publisher:
Cengage Learning

Principles of Accounting Volume 2
Accounting
ISBN:
9781947172609
Author:
OpenStax
Publisher:
OpenStax College
Cornerstones of Cost Management (Cornerstones Ser…
Accounting
ISBN:
9781305970663
Author:
Don R. Hansen, Maryanne M. Mowen
Publisher:
Cengage Learning
Managerial Accounting: The Cornerstone of Busines…
Accounting
ISBN:
9781337115773
Author:
Maryanne M. Mowen, Don R. Hansen, Dan L. Heitger
Publisher:
Cengage Learning
Principles of Accounting Volume 2
Accounting
ISBN:
9781947172609
Author:
OpenStax
Publisher:
OpenStax College

EBK CONTEMPORARY FINANCIAL MANAGEMENT
Finance
ISBN:
9781337514835
Author:
MOYER
Publisher:
CENGAGE LEARNING - CONSIGNMENT

Essentials of Business Analytics (MindTap Course …
Statistics
ISBN:
9781305627734
Author:
Jeffrey D. Camm, James J. Cochran, Michael J. Fry, Jeffrey W. Ohlmann, David R. Anderson
Publisher:
Cengage Learning

Excel Applications for Accounting Principles
Accounting
ISBN:
9781111581565
Author:
Gaylord N. Smith
Publisher:
Cengage Learning