hen faced with a difficult problem in mathematics, it often helps to draw a picture. If the oblem involves a discrete collection of interrelated objects, it is natural to sketch the objects d draw lines between them to indicate the relationships. A graph (composed of dots called rtices connected by lines or curves called edges) is the mathematical version of such a sketch. ne edges of a graph may have arrows on them; in this case, the graph is called a directed roph. Figure 1. Grepresents a directed graph, whereas H represents an undirected graph. hen we draw a graph, it doesn't really matter where we put the vertices or whether we draw e edges as curved or straight; rather, what matters is whether or not two given vertices are nnected by an edge (or edges). The degree of a vertex is the number of edges incident to it e., the number of times an edge touches it). This is different than the number of edges uching it, because an edge my form a loop; for instance, vertex x in graph H (above) has egree 5. In a directed graph, we can speak of the indegree (the number of edges coming in to e vertex) and the outdegree (the number of edges going out). Vertex a in graph G (above) . Sociologists use graphs to model social relationships. A social network is a graph where the nodes represent "actors" (e.g., people, companies) and the edges represent relationships, or "ties," between actors (e.g., friendships, business partnerships). Consider the following social network. A E a. A clique in a social network is a group of actors who all have ties to each other. What is the largest clique in this social network?


When faced with a difficult problem in mathematics, it often helps to draw a picture. If the problem involves a discrete collection of interrelated objects, it is natural to sketch the objects and draw lines between them to indicate the relationships. A graph (composed of dots called vertices connected by lines or curves called edges) is the mathematical version of such a sketch. The edges of a graph may have arrows on them; in this case, the graph is called a directed graph.
When we draw a graph, it doesn’t really matter where we put the vertices or whether we draw the edges as curved or straight; rather, what matters is whether or not two given vertices are connected by an edge (or edges). The degree of a vertex is the number of edges incident to it (i.e., the number of times an edge touches it). This is different than the number of edges touching it, because an edge my form a loop; for instance, vertex ? in graph ? (above) has degree 5. In a directed graph, we can speak of the indegree (the number of edges coming in to the vertex) and the outdegree (the number of edges going out). Vertex ? in graph ? (above) has indegree 1 and outdegree 2.
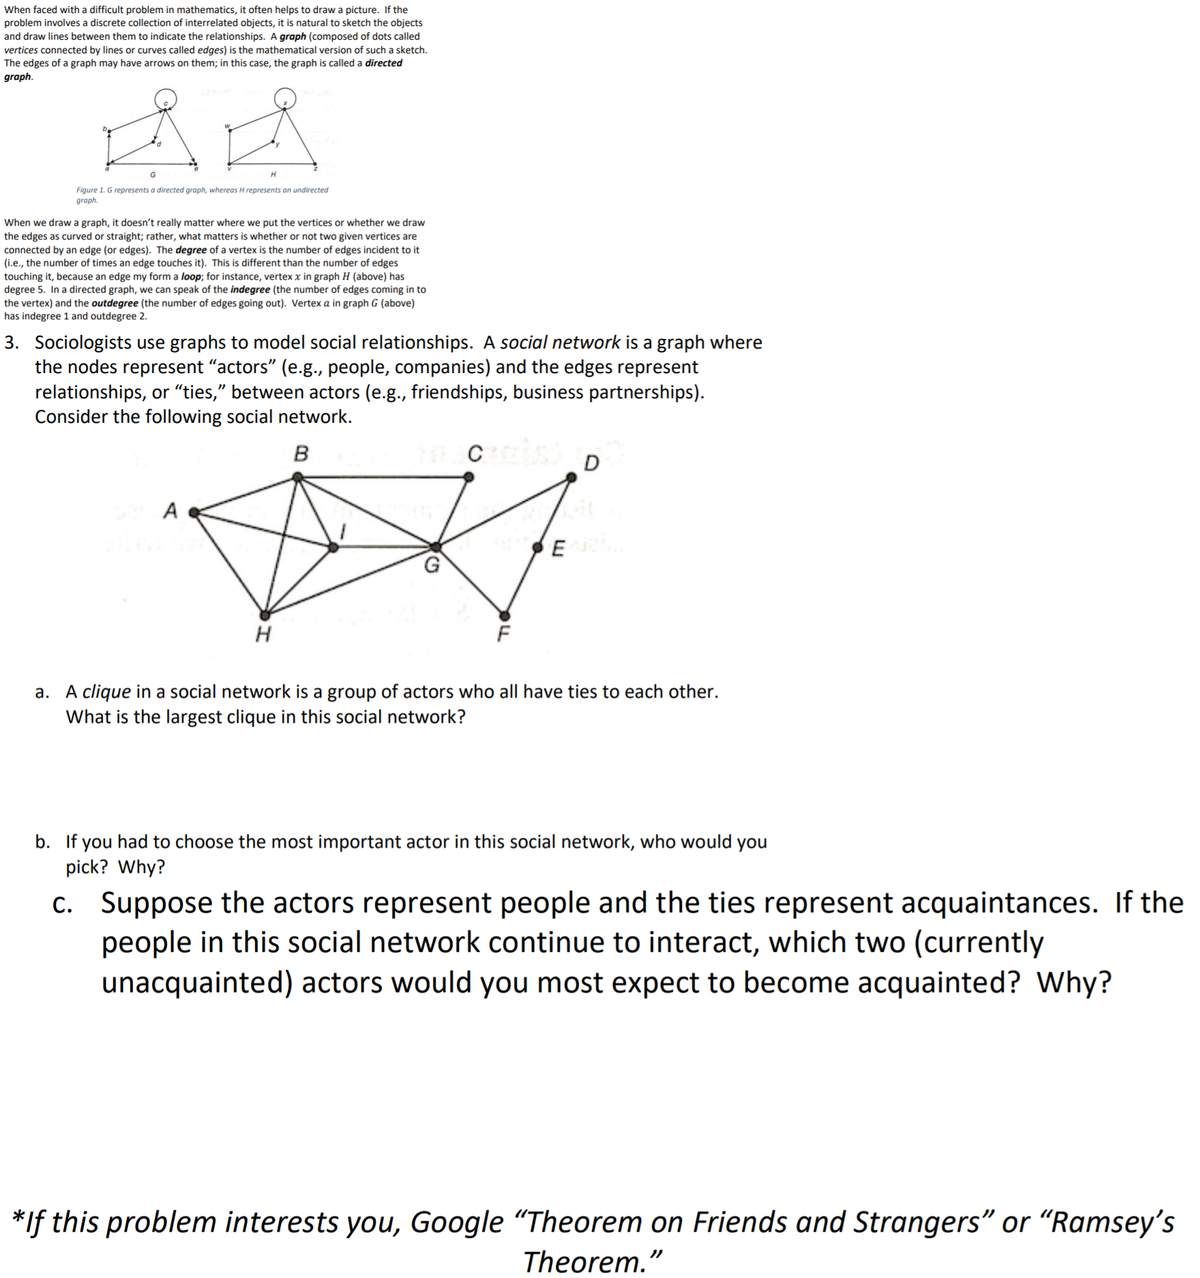
Sociologists use graphs to model social relationships. A social network is a graph where the nodes represent “actors” (e.g., people, companies) and the edges represent relationships, or “ties,” between actors (e.g., friendships, business partnerships). Consider the following social network.
a. A clique in a social network is a group of actors who all have ties to each other. What is the largest clique in this social network?
b. If you had to choose the most important actor in this social network, who would you pick? Why?
c. Suppose the actors represent people and the ties represent acquaintances. If the people in this social network continue to interact, which two (currently unacquainted) actors would you most expect to become acquainted? Why?

Step by step
Solved in 3 steps with 2 images


