Here are summary statistics for randomly selected weights of newborn girls: n = 213, x = 31.3 hg, s= 6.3 hg. Construct a confidence interval estimate of the mean. Use a 95% confidence level. Are these results very different from the confidence interval 30.2 hg < µ< 32.0 hg with only 19 sample values, x= 31.1 hg, and s= 1.8 hg? What is the confidence interval for the population mean u? Ohg
Here are summary statistics for randomly selected weights of newborn girls: n = 213, x = 31.3 hg, s= 6.3 hg. Construct a confidence interval estimate of the mean. Use a 95% confidence level. Are these results very different from the confidence interval 30.2 hg < µ< 32.0 hg with only 19 sample values, x= 31.1 hg, and s= 1.8 hg? What is the confidence interval for the population mean u? Ohg

College Algebra (MindTap Course List)
12th Edition
ISBN:9781305652231
Author:R. David Gustafson, Jeff Hughes
Publisher:R. David Gustafson, Jeff Hughes
Chapter8: Sequences, Series, And Probability
Section8.7: Probability
Problem 58E: What is meant by the sample space of an experiment?

Related questions
Topic Video
Question
Transcribed Image Text:10:09
5G 4
AA
A mathxl.com
2021SP Elementary Statistical Methods (MATH-1342-32402)
Adrian Gonzalez
04/11/21 10:09 PM
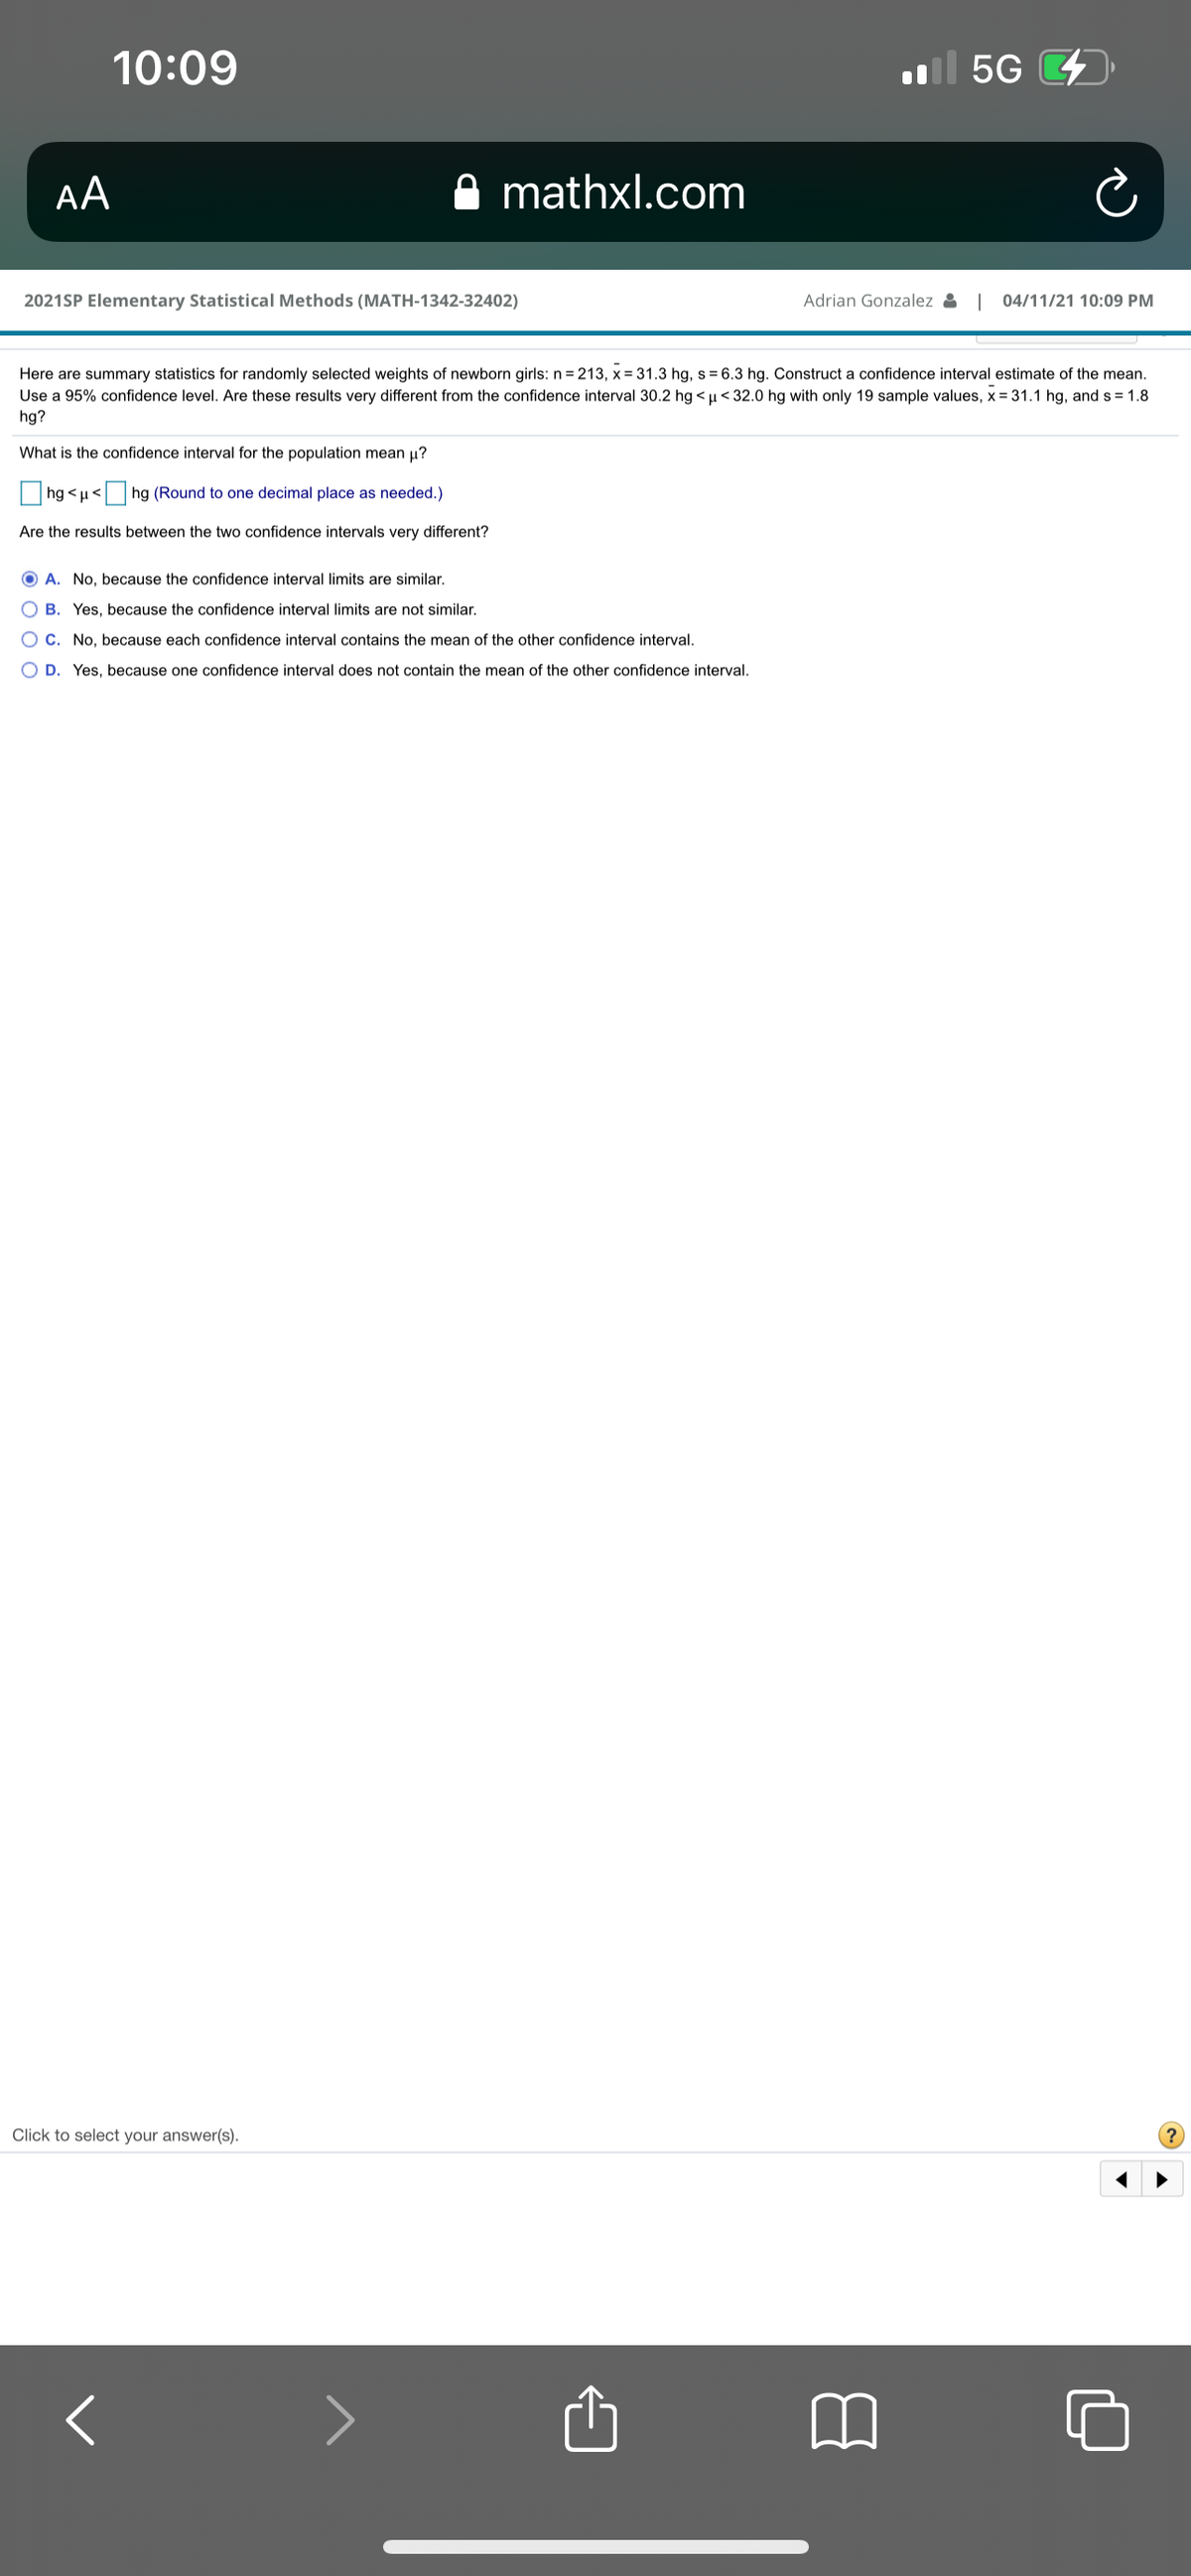
Here are summary statistics for randomly selected weights of newborn girls: n = 213, x = 31.3 hg, s = 6.3 hg. Construct a confidence interval estimate of the mean.
Use a 95% confidence level. Are these results very different from the confidence interval 30.2 hg < u< 32.0 hg with only 19 sample values, x = 31.1 hg, and s = 1.8
hg?
What is the confidence interval for the population mean u?
hg < u< hg (Round to one decimal place as needed.)
Are the results between the two confidence intervals very different?
O A. No, because the confidence interval limits are similar.
O B. Yes, because the confidence interval limits are not similar.
C. No, because each confidence interval contains the mean of the other confidence interval.
O D. Yes, because one confidence interval does not contain the mean of the other confidence interval.
Click to select your answer(s).
Expert Solution
This question has been solved!
Explore an expertly crafted, step-by-step solution for a thorough understanding of key concepts.

This is a popular solution!

Trending now
This is a popular solution!

Step by step
Solved in 3 steps

Knowledge Booster


Learn more about
Need a deep-dive on the concept behind this application? Look no further. Learn more about this topic, statistics and related others by exploring similar questions and additional content below.Recommended textbooks for you
College Algebra (MindTap Course List)
Algebra
ISBN:
9781305652231
Author:
R. David Gustafson, Jeff Hughes
Publisher:
Cengage Learning
College Algebra (MindTap Course List)
Algebra
ISBN:
9781305652231
Author:
R. David Gustafson, Jeff Hughes
Publisher:
Cengage Learning