You are conducting a test of the claim that the row variable and the column variable are dependent in the following contingency table. X Y Z A 42 22 5 B 41 31 15 Give all answers rounded to 3 places after the decimal point, if necessary. (a) Enter the expected frequencies below: X Y Z A 36.71✔ 23.44✔ 8.846✔ B 46.28✔ 29.55 (b) What is the chi-square test-statistic for this data? Test Statistic: x² x 11.15 4.523
Q: QUESTION 60 "A between-subjects ANOVA was found to be significant, with a SS-Between= 167.55 and…
A: Given that SS-between = 167.55 SS-within = 100.96
Q: A random sample of n = 16 scores to selected from a population whose mean = 219 and standa sample's…
A: Given information: n=16μ=219σ=18
Q: You wish to test the following claim (H₁) at a significance level of a = 0.001. H₂:₁ = ₂ Ha: <H₂ You…
A: Given: H0:μ1=μ2 Ha:μ1<μ2 (claim) Required: To test the claim at a significance level α=0.001
Q: QUESTION 48 A research study reports that they had 4 groups in their ANOVA analysis. How would they…
A: Given that There are 4 groups in their ANOVA analysis k = 4
Q: QUESTION 59 A repeated measures ANOVA using 15 participants observed a df-within = 42 and SS-Error =…
A: Given that dfwithin = 42 , SSerror = 20.51
Q: Suppose that the heights of adult men in the United States are normally distributed with a mean of…
A: GivenMean(μ)=69.5 inchesstandard deviation(σ)=3.5 inches
Q: Within the two areas, households were selected randomly (from the sampling frame) for inclusion.…
A: There are two types of sampling methods. They are Probability sampling and Non probability sampling.…
Q: Problem 7 A casino offers people the chance to play the following game: flip two fair coins. If both…
A: Given information: Cost of the game = $1.25 per game If both heads come up heads, the gambler win…
Q: Suppose that BC financial aid alots a textbook stipend by claiming that the average textbook at BC…
A:
Q: Let X; be random variables and M; (t) be their respective moment generating functions, for i = 1, 2,…
A: Hello! As you have posted 3 different questions, we are answering the first question. In case you…
Q: Question: A response variable has two possible explanatory variables, X₁ and X₂. Three linear models…
A: Akaike Information Criterion is a measure that estimates the amount of information lost by the given…
Q: QUESTION 39 A set of n = 53 pairs of scores (X and Y values) in a research study has a Pearson…
A: Concept: Coefficient of determination represent the amount of variation in Y that is being explained…
Q: 1. Consider the population consisting of the values (1, 3, 8). a. List all the possible samples of…
A: Since you have posted a question with multiple sub-parts for you, we will solve first 3 sub-parts…
Q: Barbara is a research biologist for Green Carpet Lawns. She is studying the effects of fertilizer…
A: From given data we have : The number of fertilizer types = 5 The number of temperature zones =4 The…
Q: d. Compute the mean of the sampling distribution of the means. e. Compute the population mean. f.…
A: Given: The population consists of the values 1, 3, 8
Q: Show that the weighted arithmetic mean of first 'n' natural numbers whose weight are equal to the…
A:
Q: A professor who teaches a large introductory statistics class (197 students) with eight discussion…
A: a) Null Hypothesis: H0: All 8 groups have same mean. Alternative Hypothesis: H1: At least one group…
Q: Jack's term mark is 72. The term mark counts for 80% of the final mark. What mark must Jack get on…
A:
Q: Find the Mean and Mode of the following data that the mass of certain worms Mass [1.2-1.5) [1.6-1.9)…
A: By using given data; Mass Frequency (f) Mid value (x) f⋅x Cumulative function(cf) 1.2-1.5 4…
Q: Your claim results in the following alternative hypothesis: Ha : μ << 168 which you test at a…
A: Given data Ha:μ<168 α=.001 we have to find critical value = ?
Q: The average effect size in social psychology is around d = 0.21. Conventionally, a sample over 30…
A: The provided information is as follows: d=0.21n1=30n2=30 Consider the significance level α=0.05.
Q: Assume that population of the first semester students in a college with below heights (in…
A: Given data: 147.4 150.4 154.7 155.5 156.3 158.1 159.3 160.6 162.1 163.5…
Q: A study was done to look at the relationship between number of vacation days employees take each…
A: The question is about correlation Given : To find : 1 ) Value of correlation coeffi. ( r ) 2 )…
Q: QUESTION 49 Which of the following Pearson correlations shows the greatest strength or consistency…
A: Given that Person correlation shows the greatest strength or consistency of relationships
Q: The following is a set of data for a population with N = 10. 15 2 1 3 10 9 9 10 9 8 a. Compute the…
A: We have given that, 15, 2, 1, 3, 10, 9, 9, 10, 9, 8 Then, We will find the population mean and…
Q: explain how you could tell by looking at a boxplot where the tallest bars onthe histogram would be…
A: A boxplot is a graph which is plotted using the quartiles and median of the dataset, while median is…
Q: If it is known that the percentage of successful students is 75%, and you take a sample of 15…
A: Givenp=0.75n=15Let "x" be the no.of successful bears x~Binomial(n=15,p=0.75)P(X=x)=(nx)(p)x(1-p)n-x…
Q: Find the mean, median, and mode for the following data set. Round your answers to one decimal place,…
A:
Q: If it is known that the percentage of successful students is 75%, and you take a sample of 15…
A: Given: The percentage of successful students is 75% Sample size n=15
Q: You are conducting a test of the claim that the row variable and the column variable are dependent…
A: For the given data We have to calculate expected frequency Chi-square statistics Critical value…
Q: EXAMPLE 11.4 TABLE 11.1 In an experiment to determine the effect of nutrition on the attention spans…
A: The question is about ANOVA Given : To construct : ANOVA table
Q: ed in their congressional district's election results has traditionally been 75%. After a series of…
A: According to guidelines we solve only first three subparts when given multiple subparts.
Q: A brokerage survey reports that 33% of all individual investors have used a discount broker (one…
A: Given that p = 33% = 0.33 , q = 1 - p = 1 - 0.33 = 0.67 n = 135
Q: our claim results in the following alternative hypothesis: Ha : μ < 152, which you test at a…
A: given data ,hypothesis :H0: μ =152H1: μ <152α=0.001 critical value =?
Q: if an ANOVA had 8 observations in each condition, calculate the value of ss- within treatments given…
A: The anova had 8 observations for each of the three conditions.
Q: TON 44 "A clinical psychologist wants to compare the efficacy of medication versus Cognitive…
A:
Q: A particular hospital's birthweight distribution is discovered to have a mean of 2700 g and a…
A: Given: μ = 2700 σ = 200 Probability = 0.95 Formula Used: According to Empirical rule 95% of the data…
Q: You are conducting a test of homogeneity for the claim that two different populations have the same…
A: Form the given information we complete the table as Category Population#1 Population#2 Total A…
Q: QUESTION 51 "An repeated measures ANOVA is used to evaluate the differences among 6 treatment…
A: Repeated measures ANOVA is the equivalent of the one-way ANOVA, but for related, not independent…
Q: how to find the critical value for the two-tailed test with a=0.10. Thanks for the help!
A: GivenThe test is two tailed testsignificance level(α)=0.10
Q: Use the Student_Data which consists of 200 MBA students at Whatsamattu U. It includes variables…
A: Given data is entered in excel ID Gender Major Employ Age MBA_GPA BS GPA Hrs_Studying Works FT…
Q: If it is known that the percentage of successful students is 75%, and you take a sample of 15…
A:
Q: When seven basketball players are about to have a free-throw competition, they often draw names out…
A: Given that: Number of basketball players, n=7 Required probability: All 7 of them will shoot in an…
Q: Using the estimated model shown above, test whether the coefficient of log(gdp_per_capita) is…
A: Test is that whether the coefficient of log(gdp-per-capita) is statistically significant It is given…
Q: QUESTION 56 "An independent-measures experiment with four treatment conditions has a sample of n =…
A: Every anova explain two types of variations. They are within variation and between variation. They…
Q: If n=31, ¯xx¯(x-bar)=38, and s=16, construct a confidence interval at a 98% confidence level. Assume…
A: given data n = 31 x¯ =38 s=16 normal distribution 98% ci for μ= ? α=1-0.98=0.02 Df = n-1 = 30
Q: Suppose Z follows the standard normal distribution. Use the calculator provided, or this table, to…
A: given data standard normal distribution x~N(0,1)here we have to find out the p(c≤Z≤-0.56)= 0.2432 we…
Q: 1,000 800 600 400 200 0 Sales of Sony Blu-Ray Disc Players at Bob's Appliance Mart (a) What kind of…
A: The given graph is a column chart with pictures for columns. Here, the size of the CD gives an…
Q: The following is a snippet of a data set on top-selling laptops on Amazon: Top-Selling Laptops on…
A: The data set on top-selling laptops are given.
Q: You wish to test the following claim (HaHa) at a significance level of α=0.05α=0.05.…
A: The question is about hypo. testing for a popl. mean Given : Null and alt. hypo : H0 : μ = 85.7Ha :…
I CANNOT SEEM TO FIND B) CHI-SQUARED TEST STATISTIC
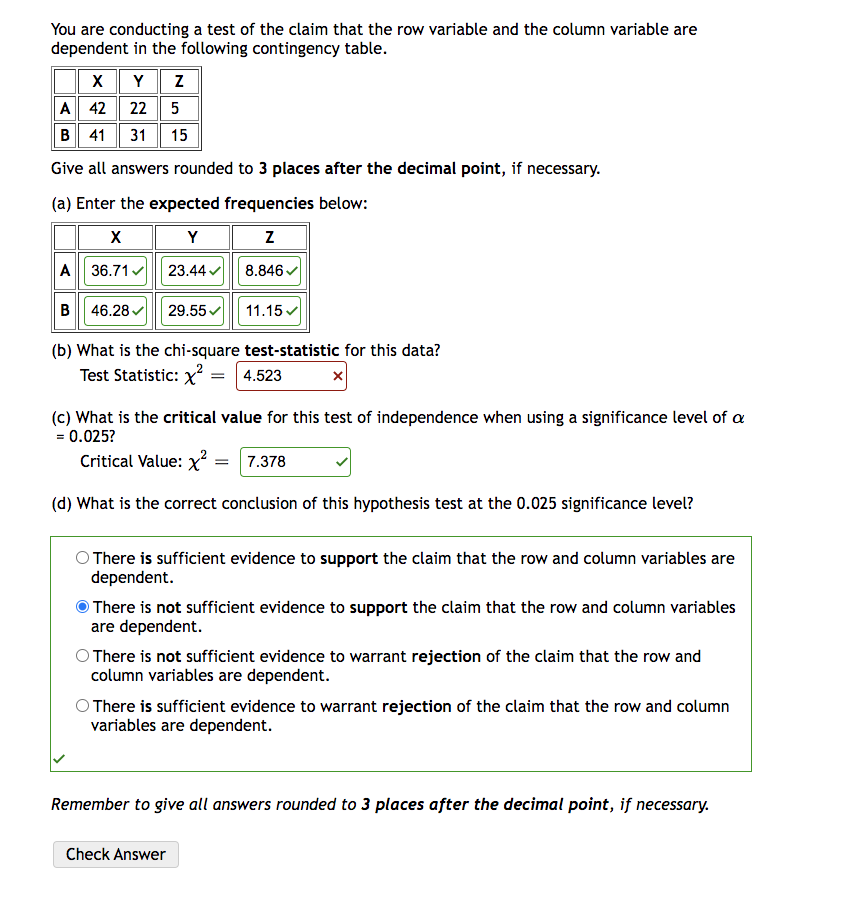
Trending now
This is a popular solution!
Step by step
Solved in 2 steps
- You are conducting a test of the claim that the row variable and the column variable are dependent in the following contingency table. X Y Z A 29 50 31 B 33 46 22 Give all answers rounded to 3 places after the decimal point, if necessary. (a) Enter the expected frequencies below: X Y Z A B (b) What is the chi-square test-statistic for this data? Test Statistic: χ2=χ2= (c) What is the critical value for this test of independence when using a significance level of αα = 0.10? Critical Value: χ2=χ2= (d) What is the correct conclusion of this hypothesis test at the 0.10 significance level? There is sufficient evidence to warrant rejection of the claim that the row and column variables are dependent. There is not sufficient evidence to warrant rejection of the claim that the row and column variables are dependent. There is not sufficient evidence to support the claim that the row and column variables are dependent. There is…You are conducting a test of the claim that the row variable and the column variable are dependent in the following contingency table. X Y Z A 67 6 30 B 66 20 29 Give all answers rounded to 3 places after the decimal point, if necessary. (a) Enter the expected frequencies below: X Y Z A B (b) What is the chi-square test-statistic for this data? Test Statistic: χ2=χ2= (c) What is the critical value for this test of independence when using a significance level of αα = 0.05? Critical Value: χ2=χ2= (d) What is the correct conclusion of this hypothesis test at the 0.05 significance level? There is sufficient evidence to warrant rejection of the claim that the row and column variables are dependent. There is not sufficient evidence to warrant rejection of the claim that the row and column variables are dependent. There is not sufficient evidence to support the claim that the row and column variables are dependent. There is…You are conducting a test of the claim that the row variable and the column variable are dependent in the following contingency table. X Y Z A 44 25 54 B 19 24 22 Give all answers rounded to 3 places after the decimal point, if necessary. (a) Enter the expected frequencies below: X Y Z A B (b) What is the chi-square test-statistic for this data? Test Statistic: χ2=χ2= (c) What is the critical value for this test of independence when using a significance level of αα = 0.10? Critical Value: χ2=χ2= (d) What is the correct conclusion of this hypothesis test at the 0.10 significance level? There is not sufficient evidence to support the claim that the row and column variables are dependent. There is not sufficient evidence to warrant rejection of the claim that the row and column variables are dependent. There is sufficient evidence to warrant rejection of the claim that the row and column variables are dependent. There is…
- You are conducting a test of the claim that the row variable and the column variable are dependent in the following contingency table. X Y Z A 53 38 24 B 39 35 7 Give all answers rounded to 3 places after the decimal point, if necessary. (a) Enter the expected frequencies below: X Y Z A B (b) What is the chi-square test-statistic for this data? Test Statistic: χ2=χ2= (c) What is the critical value for this test of independence when using a significance level of αα = 0.005? Critical Value: χ2=χ2= (d) What is the correct conclusion of this hypothesis test at the 0.005 significance level? There is not sufficient evidence to support the claim that the row and column variables are dependent. There is sufficient evidence to support the claim that the row and column variables are dependent. There is sufficient evidence to warrant rejection of the claim that the row and column variables are dependent. There is not sufficient…You are conducting a test of the claim that the row variable and the column variable are dependent in the following contingency table. X Y Z A 42 25 27 B 14 42 36 Give all answers rounded to 3 places after the decimal point, if necessary. (a) Enter the expected frequencies below: X Y Z A B (b) What is the chi-square test-statistic for this data? Test Statistic: χ2=χ2= (c) What is the critical value for this test of independence when using a significance level of α = 0.10? Critical Value: χ2= (d) What is the correct conclusion of this hypothesis test at the 0.10 significance level? There is not sufficient evidence to warrant rejection of the claim that the row and column variables are dependent. There is sufficient evidence to warrant rejection of the claim that the row and column variables are dependent. There is sufficient evidence to support the claim that the row and column variables are dependent. There is not…You are conducting a test of the claim that the row variable and the column variable are dependent in the following contingency table. X Y Z A 31 56 44 B 45 22 16 Give all answers rounded to 3 places after the decimal point, if necessary. (a) Enter the expected frequencies below: X Y Z A B (b) What is the chi-square test-statistic for this data? Test Statistic: χ2=χ2= (c) What is the critical value for this test of independence when using a significance level of αα = 0.10? Critical Value: χ2=χ2= (d) What is the correct conclusion of this hypothesis test at the 0.10 significance level? There is not sufficient evidence to support independence of the row and column variables. There is sufficient evidence to support independence of the row and column variables. There is sufficient evidence to reject independence of the row and column variables. There is not sufficient evidence to reject independence of the row and column…
- You are conducting a test of the claim that the row variable and the column variable are dependent in the following contingency table. X Y Z A 12 22 75 B 26 18 26 Give all answers rounded to 3 places after the decimal point, if necessary. (a) Enter the expected frequencies below: X Y Z A B (b) What is the chi-square test-statistic for this data? Test Statistic: χ2=χ2= (c) What is the critical value for this test of independence when using a significance level of αα = 0.005? Critical Value: χ2=χ2= (d) What is the correct conclusion of this hypothesis test at the 0.005 significance level? There is not sufficient evidence to warrant rejection of the claim that the row and column variables are dependent. There is sufficient evidence to support the claim that the row and column variables are dependent. There is not sufficient evidence to support the claim that the row and column variables are dependent. There is sufficient…You are conducting a test of the claim that the row variable and the column variable are dependent in the following contingency table. X Y Z A 22 7 39 B 23 8 42 Give all answers rounded to 3 places after the decimal point, if necessary. (a) Enter the expected frequencies below: X Y Z A B (b) What is the chi-square test-statistic for this data? Test Statistic: χ2=χ2= (c) What is the critical value for this test of independence when using a significance level of αα = 0.05? Critical Value: χ2=χ2=You are conducting a test of the claim that the row variable and the column variable are dependent in the following contingency table. X Y Z A 25 15 26 B 12 53 42 Give all answers rounded to 3 places after the decimal point, if necessary.(a) Enter the expected frequencies below: X Y Z A B b) What is the chi-square test-statistic for this data? Test Statistic: χ2= (c) What is the critical value for this test of independence when using a significance level of α= 0.05? Critical Value: χ2=(d) What is the correct conclusion of this hypothesis test at the 0.05 significance level? There is not sufficient evidence to support the claim that the row and column variables are dependent. There is sufficient evidence to warrant rejection of the claim that the row and column variables are dependent. There is sufficient evidence to support the claim that the row and column variables are dependent. There is not sufficient evidence to warrant rejection of…
- a. Assuming for the moment that all coefficients are significant, please interpret the coefficients of the four independent variables in the BIG b. To determine which of the two models above is statistically superior at the .10 level, please calculate the appropriate F‐statistic.You are conducting a test of the claim that the row variable and the column variable are dependent in the following contingency table. X Y Z A 37 41 11 B 54 31 23 Give all answers rounded to 3 places after the decimal point, if necessary. (a) Enter the expected frequencies below: X Y Z A B (b) What is the chi-square test-statistic for this data? Test Statistic: χ2= (c) What is the critical value for this test of independence when using a significance level of α = 0.10? Critical Value: χ2= (d) What is the correct conclusion of this hypothesis test at the 0.10 significance level? There is sufficient evidence to warrant rejection of the claim that the row and column variables are dependent. There is not sufficient evidence to support the claim that the row and column variables are dependent. There is not sufficient evidence to warrant rejection of the claim that the row and column variables are dependent. There is sufficient…You are conducting a test of the claim that the row variable and the column variable are dependent in the following contingency table. X Y Z A 21 39 33 B 15 47 30 Give all answers rounded to 3 places after the decimal point, if necessary. (a) Enter the expected frequencies below: X Y Z A B (b) What is the chi-square test-statistic for this data? Test Statistic: χ2=____________ (c) What is the critical value for this test of independence when using a significance level of α = 0.005? Critical Value: χ2=________ (d) What is the correct conclusion of this hypothesis test at the 0.005 significance level?___________ There is sufficient evidence to support the claim that the row and column variables are dependent. There is not sufficient evidence to warrant rejection of the claim that the row and column variables are dependent. There is sufficient evidence to warrant rejection of the claim that the row and column variables are…