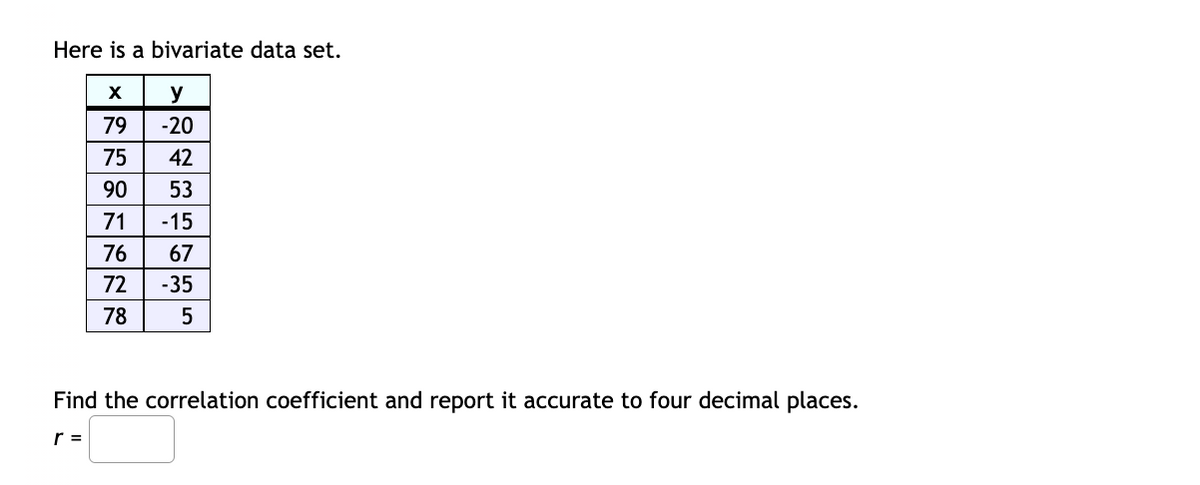
Here is a bivariate data set. y 79 -20 75 42 90 53 71 -15 76 67 72 -35 78 Find the correlation coefficient and report it accurate to four decimal places. r =


Q: Question 2 2.1. Let Y,, Y, .., , be a random sample of size 4 from an exponential with parameters…
A: Introduction: Exponential Distribution: A continuous random variable follows Exponential…
Q: What happens to availability if the mean time between failures (MTTR) gets close to zero? Is it…
A:
Q: Find the area under the standard normal curve that lies between z=0.55 and z = - 1.93 2. Find the…
A: As per company guidelines I solved only First questions ..thank you
Q: If S = (0, 1, 2, 3, 4, 5, 6, 7, 8, 9} and A = (0, 2, 4, 6, 8), B = (1, 3, 5, 7, 9), C = (2, 3, 4,…
A: As per our guidelines we are suppose to answer three sub parts.…
Q: A fair six - sided die is rolled.Find a. The odds that the number is even. b. The odd number is:…
A: Given that, a fair six-sided die is rolled.
Q: If za/2 = 1.70100, determine the proportion of (1-a)100% confidence intervals that will not capture…
A:
Q: The following table represents the survey conducted in a school. Male female Chicken fried steak…
A:
Q: Figure Spifference for each of the following studies. N2 20 (a) (b) (C) (d) (e) 5 40 60 20 60 30 30…
A: Given Differences between N1 S21 N2 S22
Q: A high school athletic director is asked if basketball players are doing as well academically as the…
A: Given that Sample size n =20 Sample mean =3.18 Sample standard deviation =0.54
Q: Open Geogebra and choose "Spreadsheet." You can also get to the Spreadsheet through the "View" menu.…
A: 1) Mean of x 2) Mean of y
Q: Two sample sizes of 15 and 10 were taken from a male and a female population, respectively. What is…
A: Here is given, two sample size, male is 15 and female is 10 from a population.
Q: Keeping water supplies clean requires regular measurement of levels of pollutants. To calibrate such…
A:
Q: 3. The heart rate for a group of patients at a local hospital is normally distributed with a mean of…
A: Given that mu = 97,s.d=18
Q: Does the type of painting and the tray on which the parts are placed affect the mean hardness of the…
A: Count Var A \ Var B B-Category-1 B-Category-2 B-Category-3 Total A-Category-1 5 5 5…
Q: The table below shows the number of state-registered automatic weapons and the murder rate for…
A: The independent variable is thousands of automatic weapons. The dependent variable is murders per…
Q: b) The table below shows the color and the model of cars purchased by 160 randomly selected…
A: The given data is: .
Q: QUESTION 7 A random sample of 25 children proportion of children that like Yummy Gummy candy…
A: Given that n=25 , X=22 X=Number of children indicating like the candy n=Total number of sample
Q: Construct the sampling distribution of the sample mean for the following population and with the…
A: Given that the population is Xi: 2,9,11,14 We'll draw the samples of size 2 from the given…
Q: month only A SOcial psychologist studying mass communication randofmly assigned 77 from television,…
A: Solution: Given information: ntv=57nI=20Mtv= 22MI= 26.2s2tv= 2s2I= 3s2p= 2.2533 Pooled variance
Q: Consider the following probability distribution. What is the probability that Y is not less than 2?…
A: Given that Probability distribution. Y 0 1 2 3 4 5 P(Y) 0.009 0.376 0.371 0.167 0.061 0.016
Q: "A clinical trial was conducted to test the effectiveness of a drug for treating insomnia in older…
A: Given Population mean μ=94.6, n=sample size=20, sample mean x̄=71.5, sample standard deviations…
Q: What proportion of the standard normal distribution lies outside the interval ±0.2525? Please use…
A: From the given information we find the solution.
Q: deviation approximately 4 square inches. a. If the forester samples n = 9 trees, find the…
A: here AS PER GUIDELINES I HAVE CALCULATED FIRST MAIN QUESTION 1. A forester studying the effects of…
Q: 3. For two independent events, A and B, P(A)=D0.1 and P(B)-D0.5. Enter your probabilities as…
A:
Q: Question 2: In order to determine the miles per gallon rating for a new midsize minivan, an…
A: Given: Sample meanx¯=31.56Sample standard deviation(s)=0.798Sample size(n)=31.56
Q: In a hotel, two dishes- vegetables and non-vegetables are demanded. 80% of its male customers order…
A:
Q: scenarios. 5- 1. The mean annual income of workers who are college graduates is greater than…
A: We have given that the statements about to the null and alternative hypotheses. Note: According…
Q: If there are five different toy cars, and you want to put fifteen toy cars on the display, how many…
A: Permutation is the measurement of principle counting. It is measure that arrange the data in an…
Q: Show work please and r studio.
A: Given The data is as follows: Sample size, n=58Sample mean, x¯=0.0328Pop. sd, σ=0.015CL=95%
Q: You are an econometrician working in the Ministry of Finance in Trinidad and Tobago and using a…
A: Please note that as per our guidelines we can answer the first question if multiple questions are…
Q: X. Given P(A) = 0.2, P(B) = 0.7, P(A | B) = 0.3, do the following. %3D %3D %3D (a) Compute P(A and…
A: Here use basic probability rule
Q: the blood drive, what's the probability that the clinic will not have sufficient O-negative donors?
A: People with O-negative blood are called "universal donors" because O negative blood can be given to…
Q: Construct a frequency table for the follwing data. The example of the table is shown below.
A: Frequency distribution is used to tabulate the group of individual observations. Each frequency…
Q: The average wait time to get seated at a popular restaurant in the city on a Friday night is 12…
A: Given that Sample size n =12 Population mean μ =12 NOTE:- According to bartleby guidelines expert…
Q: NEED THE ANSWER FOR D. The maintenance manager at a trucking company wants to build a regression…
A: Given Time=13.95-0.09 miles-0.02 Load-0.01 speed-0.06 Oil
Q: r each of the 4 groups are presented below: Std. Deviation can Std. Error 080 .4324 .1934 680 3768…
A: Given, By applying the ANOVA test for a single factor, grand mean, x̅̅ =…
Q: Question 2 (Simulation) The management of Brinkley Corporation is interested in using simulation to…
A:
Q: If n= 25 , M = 20%, M = 10%, and s - 15%, Did the training significantly reduce how much the…
A:
Q: The life insurance policies of an insurance company are classified by: • Age of the insured I. •…
A: Since you asked multiple question, we will solve the question for you. If you want any question to…
Q: Match each scatterplot shown below with one of the four specified correlations. a. 0.38 b. -0.90 c.…
A: The best suited possible values for the coefficient of correlation are to be assigned to the…
Q: VII. Given the binomial experiment with n = 100 trials and probability of success on a single trial…
A: Given that, the binomial experiment with n = 100 trials and probability of success on a single trial…
Q: According to USPS study, the weights of shipment packages are normally distributed with a mean of…
A:
Q: 4. In a survey of 80 students, 33 liked watching anime, 18 enjoyed watching both anime and kdrama,…
A: We create Venn diagram for the above situation.
Q: 4. Derive the mean and variance of the t distribution. 5. Suppose that X1, X2,Xm and Y1,Y2, Yn are…
A: Given two problem related to t distribution and normal distribution. We have to solve the problems…
Q: Answer only the 2 questions
A: Given
Q: Describe the histograms for the leaf length and the leaf width
A: Histogram is a graphical form that represent the categorical data. It is type of bar chart, since…
Q: 3. A student conducted an experiment to see which, if any, of four different paper airplane designs…
A: dferror
Q: The scatter plot is used to examine the relationships between different functions in the statistical…
A: Solution: Scatter plot: Scatter plot is a graphical technique or method of identifying the linear…
Q: Part I Two cards are chosen from a pack of cards without replacement. Are the following events…
A: Given that Two cards are chosen from a pack of cards without replacement. Events A : The first card…
Q: e. Using 50 random numbers given below, compute the mean and standard deviation. 0.572659 0.378380…
A: The random variable X follows normal distribution. We have to find the mean and standard deviation…


Trending now
This is a popular solution!

Step by step
Solved in 4 steps with 4 images

- Here is a bivariate data set.xy182425915011737106295223812246 Find the correlation coefficient and report it accurate to four decimal places. r =Here is a bivariate data set.x y71 461 555 6148 -876 3126 7074 -62 Find the correlation coefficient and report it accurate to four decimal places.r =Here is a bivariate data set.x8570.36366.470.2 y48.574.7-56.66253.9 Find the correlation coefficient and report it accurate to three decimal places. r =
- Here is a bivariate data set. x y 10 246 2 122 54 36 31 -27 -23 7 18 -9 -3 241 Find the correlation coefficient and report it accurate to four decimal placesHere is a bivariate data set. (PS 0.5828 IS NOT CORRECT) x y 71 4 61 5 55 61 48 -8 76 31 26 70 74 -62 Find the correlation coefficient and report it accurate to four decimal places.r =Find the coefficient of determination, given that the value of the linear correlation coefficient, r, is 0.681. (Round to four decimal places.)
- Here is a bivariate data set. x y 90.3 55.6 61.9 26 52.3 -41.9 60.6 -104.5 43.2 43.9 69.7 104 Find the correlation coefficient and report it accurate to three decimal places.r =Here is a bivariate data set. x y -2.6 120.6 30.5 34.9 40.1 85.3 18.2 82.2 14.8 89.6 21.8 69.3 36.3 49.9 49.1 25.7 32.3 56.6 52.2 -8.4 Use technology to find the correlation coefficient and report it accurate to three decimal places.Here is a bivariate data set. x y 37 46 43 43 63 -8 61 8 79 -38 37 56 45 44 Find the correlation coefficient and report it accurate to four decimal places.r =
- A researcher computes the correlation coefficient r =r= 0.6939 for an explanatory and response variable. What proportion of the changes in the response variables value is accounted for by the change in the explanatory variable's value? Give your answer to four decimal places.Choose the value of the Pearson's Correlation Coefficient (r) that best describes the two plots. : 0.504, II: -0.232. 2) I: -0.904, II: 0.232. 3) I: 0.904, II: -0.232. 4) I: -0.232, II: 1.304. 5) I: 0.904, II: -0.632.Here is a bivariate data set. x y 65.4 79.9 85 115.5 84.9 45.4 77.1 76.3 85.4 51.3 68.3 56.9 94.1 -5.1 62.6 57.6 83.8 51.2 84 50.2 Find the correlation coefficient and report it accurate to three decimal places. r =