Here's a table with average monthly price of a stock from Jan 2021-July 2021. Month Price Jan 29000 Feb 27000 Mar 31000 Apr 30000 May 32000 June 28000 July 29000 Using a 3-period weighted moving average with weights (wt, wt-1, wt-2) = (0.6, 0.2, 0.2), the predicted price August is Using an exponential smoothing model with = 0.4, and with the initial predicted price for Jan the same as the observed price for January, the predicted price for August is % Now, let's suppose that we finally observe that the price for August is 30000. The absolute percent error (APE) of your prediction for August is using the weighted moving average method and % using the exponential smoothing model. (Note: Round your answer to the nearest 2 decimal places. For your APE answer for example let's say you get 0.06786 from Excel, then you should type-in 6.79 as your answer here since it is represented as percentage. Do not enter any symbols other than integers and decimal.)
Here's a table with average monthly price of a stock from Jan 2021-July 2021. Month Price Jan 29000 Feb 27000 Mar 31000 Apr 30000 May 32000 June 28000 July 29000 Using a 3-period weighted moving average with weights (wt, wt-1, wt-2) = (0.6, 0.2, 0.2), the predicted price August is Using an exponential smoothing model with = 0.4, and with the initial predicted price for Jan the same as the observed price for January, the predicted price for August is % Now, let's suppose that we finally observe that the price for August is 30000. The absolute percent error (APE) of your prediction for August is using the weighted moving average method and % using the exponential smoothing model. (Note: Round your answer to the nearest 2 decimal places. For your APE answer for example let's say you get 0.06786 from Excel, then you should type-in 6.79 as your answer here since it is represented as percentage. Do not enter any symbols other than integers and decimal.)

MATLAB: An Introduction with Applications
6th Edition
ISBN:9781119256830
Author:Amos Gilat
Publisher:Amos Gilat
Chapter1: Starting With Matlab
Section: Chapter Questions
Problem 1P

Related questions
Question
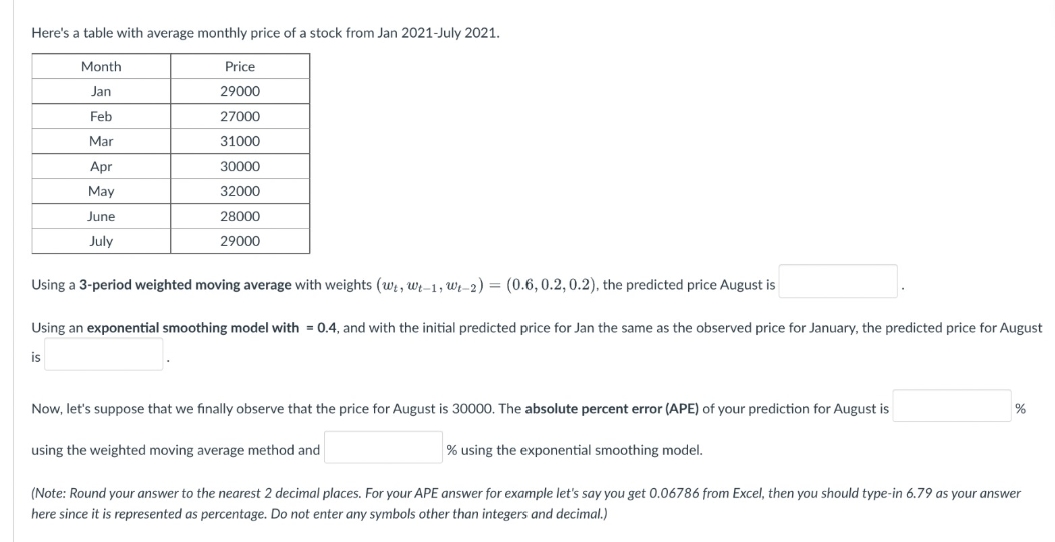
Transcribed Image Text:Here's a table with average monthly price of a stock from Jan 2021-July 2021.
Month
Price
Jan
29000
Feb
27000
Mar
31000
Apr
30000
May
32000
June
28000
July
29000
Using a 3-period weighted moving average with weights (wt, wt-1, W-2) = (0.6, 0.2, 0.2), the predicted price August is
Using an exponential smoothing model with = 0.4, and with the initial predicted price for Jan the same as the observed price for January, the predicted price for August
is
%
Now, let's suppose that we finally observe that the price for August is 30000. The absolute percent error (APE) of your prediction for August is
using the weighted moving average method and
% using the exponential smoothing model.
(Note: Round your answer to the nearest 2 decimal places. For your APE answer for example let's say you get 0.06786 from Excel, then you should type-in 6.79 as your answer
here since it is represented as percentage. Do not enter any symbols other than integers and decimal.)
Expert Solution
This question has been solved!
Explore an expertly crafted, step-by-step solution for a thorough understanding of key concepts.

Step by step
Solved in 3 steps with 3 images

Recommended textbooks for you
MATLAB: An Introduction with Applications
Statistics
ISBN:
9781119256830
Author:
Amos Gilat
Publisher:
John Wiley & Sons Inc

Probability and Statistics for Engineering and th…
Statistics
ISBN:
9781305251809
Author:
Jay L. Devore
Publisher:
Cengage Learning

Statistics for The Behavioral Sciences (MindTap C…
Statistics
ISBN:
9781305504912
Author:
Frederick J Gravetter, Larry B. Wallnau
Publisher:
Cengage Learning
MATLAB: An Introduction with Applications
Statistics
ISBN:
9781119256830
Author:
Amos Gilat
Publisher:
John Wiley & Sons Inc
Probability and Statistics for Engineering and th…
Statistics
ISBN:
9781305251809
Author:
Jay L. Devore
Publisher:
Cengage Learning
Statistics for The Behavioral Sciences (MindTap C…
Statistics
ISBN:
9781305504912
Author:
Frederick J Gravetter, Larry B. Wallnau
Publisher:
Cengage Learning

Elementary Statistics: Picturing the World (7th E…
Statistics
ISBN:
9780134683416
Author:
Ron Larson, Betsy Farber
Publisher:
PEARSON

The Basic Practice of Statistics
Statistics
ISBN:
9781319042578
Author:
David S. Moore, William I. Notz, Michael A. Fligner
Publisher:
W. H. Freeman

Introduction to the Practice of Statistics
Statistics
ISBN:
9781319013387
Author:
David S. Moore, George P. McCabe, Bruce A. Craig
Publisher:
W. H. Freeman