his dot plot (burglary rates per 100,000 persons in 350 U.S. cities) shows a distribution that is skewed to the left (negatively skewed). 200 400 600 s00 1000 1200 1400 1600 1800 2000 200 Buglry True or False True False
his dot plot (burglary rates per 100,000 persons in 350 U.S. cities) shows a distribution that is skewed to the left (negatively skewed). 200 400 600 s00 1000 1200 1400 1600 1800 2000 200 Buglry True or False True False

Glencoe Algebra 1, Student Edition, 9780079039897, 0079039898, 2018
18th Edition
ISBN:9780079039897
Author:Carter
Publisher:Carter
Chapter10: Statistics
Section: Chapter Questions
Problem 2SGR

Related questions
Question
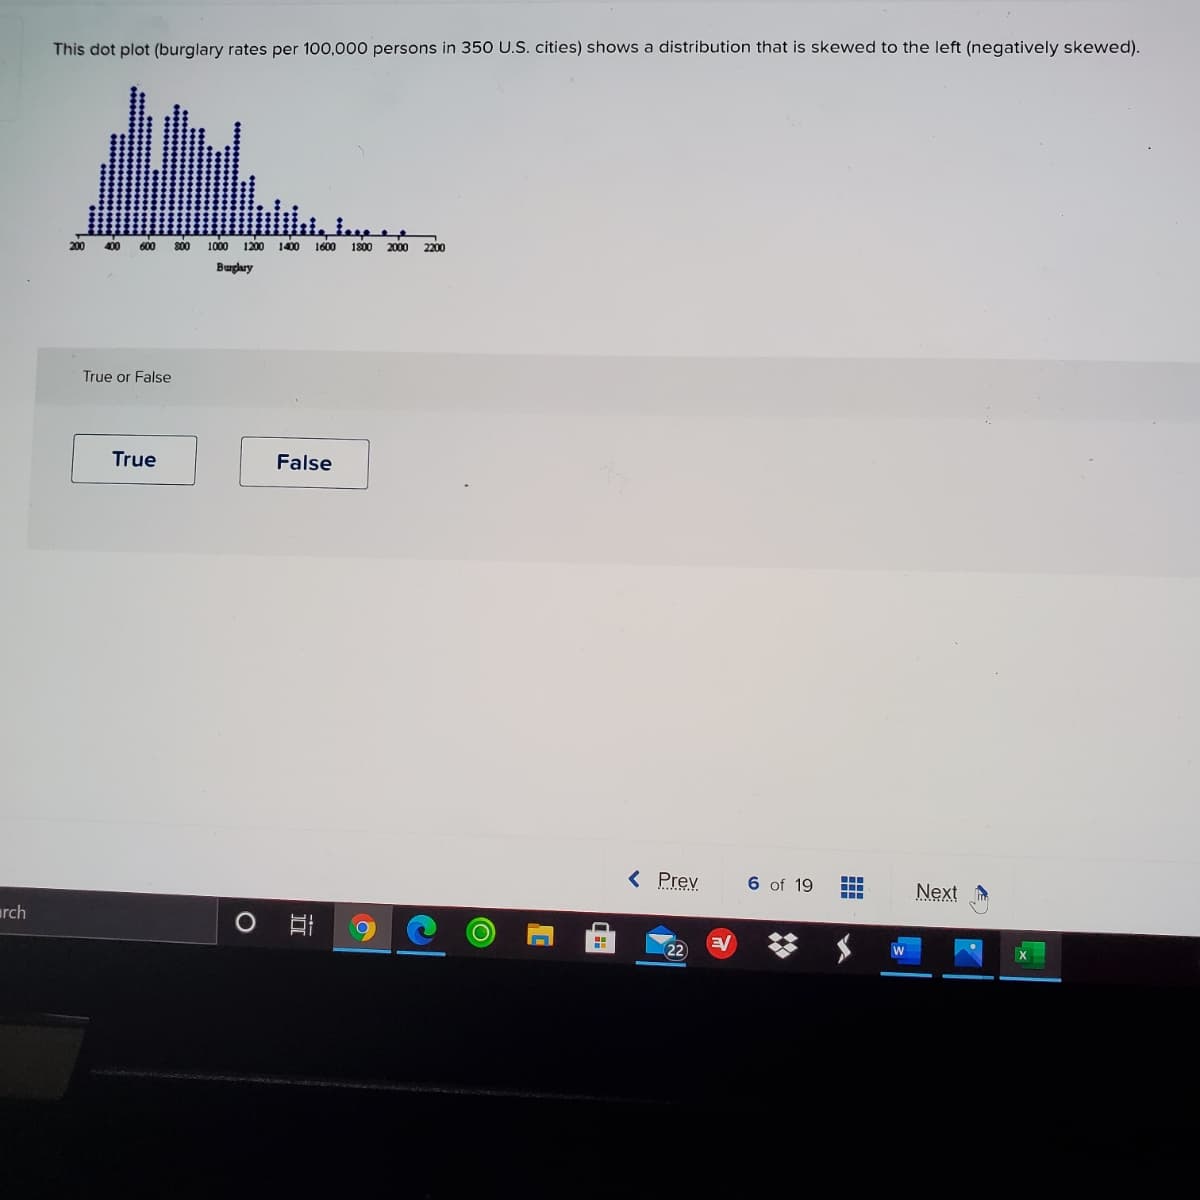
Transcribed Image Text:This dot plot (burglary rates per 100,000 persons in 350 U.S. cities) shows a distribution that is skewed to the left (negatively skewed).
200
400
600
S00
1000
1200 1400 1600 1800
2000 2200
Buglary
True or False
True
False
< Prev
6 of 19
Next
arch
22
Expert Solution
This question has been solved!
Explore an expertly crafted, step-by-step solution for a thorough understanding of key concepts.

This is a popular solution!

Trending now
This is a popular solution!

Step by step
Solved in 2 steps

Recommended textbooks for you
Glencoe Algebra 1, Student Edition, 9780079039897…
Algebra
ISBN:
9780079039897
Author:
Carter
Publisher:
McGraw Hill

Big Ideas Math A Bridge To Success Algebra 1: Stu…
Algebra
ISBN:
9781680331141
Author:
HOUGHTON MIFFLIN HARCOURT
Publisher:
Houghton Mifflin Harcourt

Holt Mcdougal Larson Pre-algebra: Student Edition…
Algebra
ISBN:
9780547587776
Author:
HOLT MCDOUGAL
Publisher:
HOLT MCDOUGAL
Glencoe Algebra 1, Student Edition, 9780079039897…
Algebra
ISBN:
9780079039897
Author:
Carter
Publisher:
McGraw Hill
Big Ideas Math A Bridge To Success Algebra 1: Stu…
Algebra
ISBN:
9781680331141
Author:
HOUGHTON MIFFLIN HARCOURT
Publisher:
Houghton Mifflin Harcourt
Holt Mcdougal Larson Pre-algebra: Student Edition…
Algebra
ISBN:
9780547587776
Author:
HOLT MCDOUGAL
Publisher:
HOLT MCDOUGAL