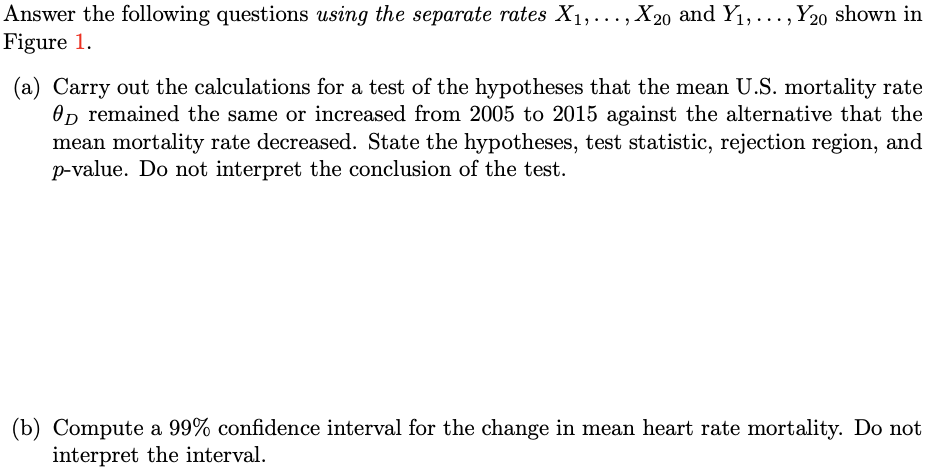
Below, Figure 1 shows the distributions of mortality rates for 20 randomly selected U.S. states in 2005 and 2015, as well as a stacked bar chart of the rates for individual states. In the bar chart, the height of the blue bar shows the rate in 2015, and the height of the red bar shows the rate in 2005. 2005 2015 0.020 - 0.015- 0.010- 0.005 - 0.000 - 150 Heart disease mortality rate 100 150 200 250 100 200 250 400 - 300 - Year 2005 200- 2015 100- 0- State Figure 1: Top, histograms of age-adjusted heart disease mortality rates (deaths per 100,000) for each of 20 randomly selected states in 2005 and in 2015; bottom, stacked bar chart of rates for each state by year. Heart disease mortality rate density
Below, Figure 1 shows the distributions of mortality rates for 20 randomly selected U.S. states in 2005 and 2015, as well as a stacked bar chart of the rates for individual states. In the bar chart, the height of the blue bar shows the rate in 2015, and the height of the red bar shows the rate in 2005. 2005 2015 0.020 - 0.015- 0.010- 0.005 - 0.000 - 150 Heart disease mortality rate 100 150 200 250 100 200 250 400 - 300 - Year 2005 200- 2015 100- 0- State Figure 1: Top, histograms of age-adjusted heart disease mortality rates (deaths per 100,000) for each of 20 randomly selected states in 2005 and in 2015; bottom, stacked bar chart of rates for each state by year. Heart disease mortality rate density

MATLAB: An Introduction with Applications
6th Edition
ISBN:9781119256830
Author:Amos Gilat
Publisher:Amos Gilat
Chapter1: Starting With Matlab
Section: Chapter Questions
Problem 1P

Related questions
Question
Transcribed Image Text:Answer the following questions using the separate rates X1,..., X20 and Y1,..., Y20 shown in
Figure 1.
(a) Carry out the calculations for a test of the hypotheses that the mean U.S. mortality rate
On remained the same or increased from 2005 to 2015 against the alternative that the
mean mortality rate decreased. State the hypotheses, test statistic, rejection region, and
p-value. Do not interpret the conclusion of the test.
(b) Compute a 99% confidence interval for the change in mean heart rate mortality. Do not
interpret the interval.
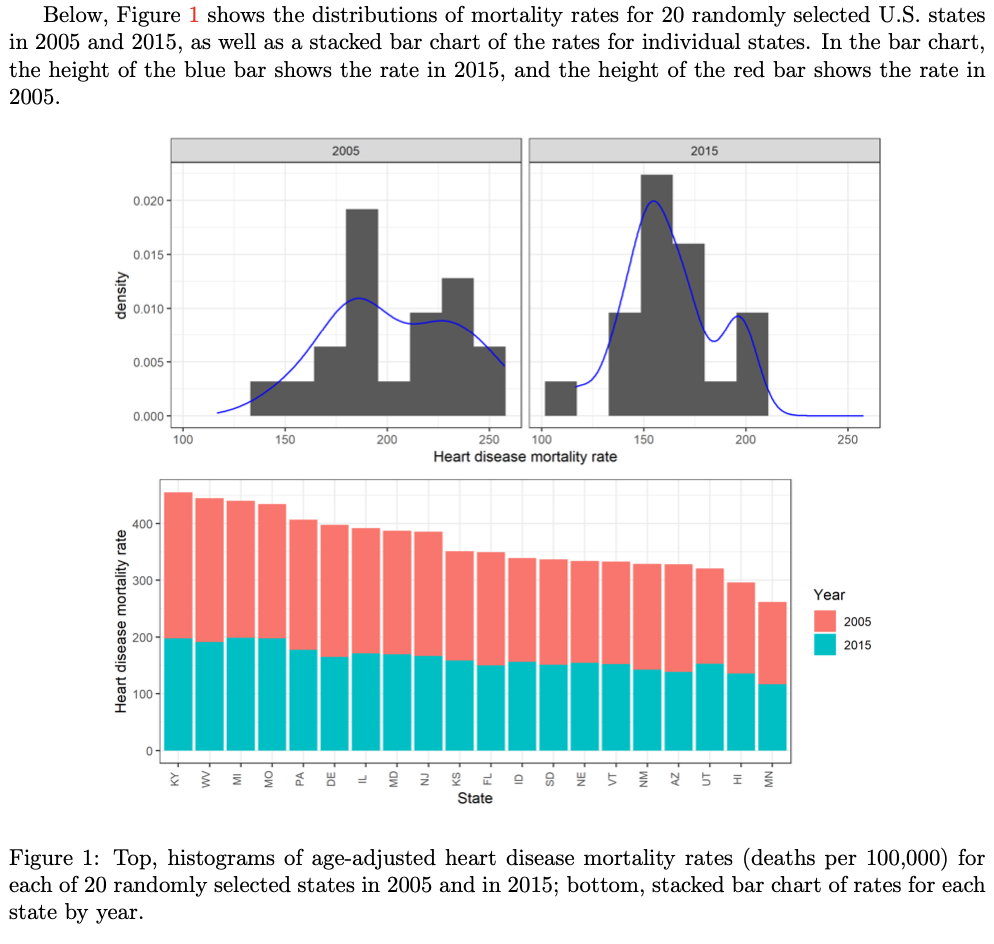
Transcribed Image Text:Below, Figure 1 shows the distributions of mortality rates for 20 randomly selected U.S. states
in 2005 and 2015, as well as a stacked bar chart of the rates for individual states. In the bar chart,
the height of the blue bar shows the rate in 2015, and the height of the red bar shows the rate in
2005.
2005
2015
0.020 -
0.015-
0.010-
0.005 -
0.000 -
200
250
200
100
Heart disease mortality rate
100
150
150
250
400 -
300 -
Year
2005
200 -
2015
100-
State
Figure 1: Top, histograms of age-adjusted heart disease mortality rates (deaths per 100,000) for
each of 20 randomly selected states in 2005 and in 2015; bottom, stacked bar chart of rates for each
state by year.
Heart disease mortality rate
density
Expert Solution
This question has been solved!
Explore an expertly crafted, step-by-step solution for a thorough understanding of key concepts.

This is a popular solution!

Trending now
This is a popular solution!

Step by step
Solved in 2 steps with 3 images

Recommended textbooks for you
MATLAB: An Introduction with Applications
Statistics
ISBN:
9781119256830
Author:
Amos Gilat
Publisher:
John Wiley & Sons Inc

Probability and Statistics for Engineering and th…
Statistics
ISBN:
9781305251809
Author:
Jay L. Devore
Publisher:
Cengage Learning

Statistics for The Behavioral Sciences (MindTap C…
Statistics
ISBN:
9781305504912
Author:
Frederick J Gravetter, Larry B. Wallnau
Publisher:
Cengage Learning
MATLAB: An Introduction with Applications
Statistics
ISBN:
9781119256830
Author:
Amos Gilat
Publisher:
John Wiley & Sons Inc
Probability and Statistics for Engineering and th…
Statistics
ISBN:
9781305251809
Author:
Jay L. Devore
Publisher:
Cengage Learning
Statistics for The Behavioral Sciences (MindTap C…
Statistics
ISBN:
9781305504912
Author:
Frederick J Gravetter, Larry B. Wallnau
Publisher:
Cengage Learning

Elementary Statistics: Picturing the World (7th E…
Statistics
ISBN:
9780134683416
Author:
Ron Larson, Betsy Farber
Publisher:
PEARSON

The Basic Practice of Statistics
Statistics
ISBN:
9781319042578
Author:
David S. Moore, William I. Notz, Michael A. Fligner
Publisher:
W. H. Freeman

Introduction to the Practice of Statistics
Statistics
ISBN:
9781319013387
Author:
David S. Moore, George P. McCabe, Bruce A. Craig
Publisher:
W. H. Freeman