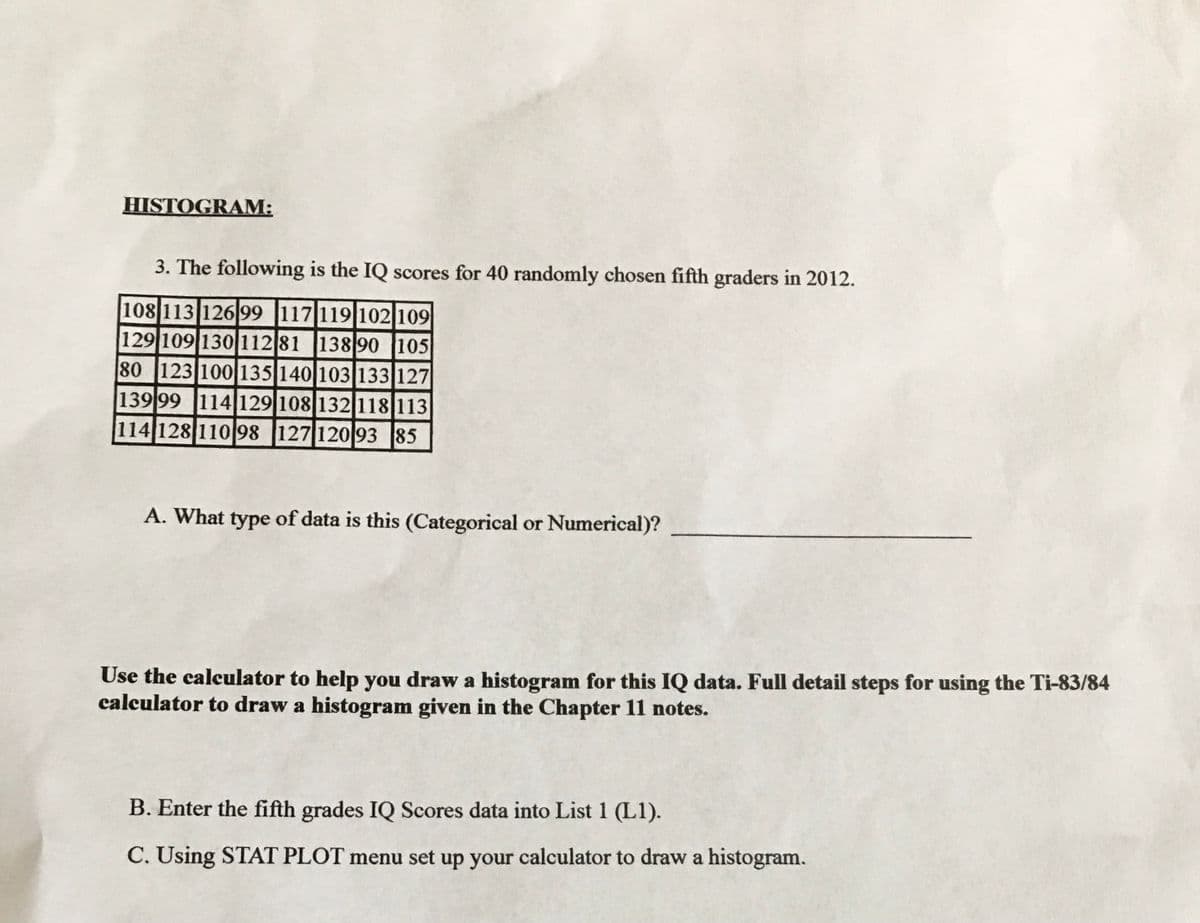
HISTOGRAM: 3. The following is the IQ scores for 40 randomly chosen fifth graders in 2012. 108 113 126 99 117 119 102|109 129 109 130112 81 138 90 105 80 123 100135 140 103 133 127 139 99 114129 108 132 118 113 114 128 110 98 127 120 93 85 A. What type of data is this (Categorical or Numerical)? Use the calculator to help you draw a histogram for this IQ data. Full detail steps for using the Ti-83/84 calculator to draw a histogram given in the Chapter 11 notes. B. Enter the fifth grades IQ Scores data into List 1 (L1). C. Using STAT PLOT menu set up your calculator to draw a histogram.


Inverse Normal Distribution
The method used for finding the corresponding z-critical value in a normal distribution using the known probability is said to be an inverse normal distribution. The inverse normal distribution is a continuous probability distribution with a family of two parameters.
Mean, Median, Mode
It is a descriptive summary of a data set. It can be defined by using some of the measures. The central tendencies do not provide information regarding individual data from the dataset. However, they give a summary of the data set. The central tendency or measure of central tendency is a central or typical value for a probability distribution.
Z-Scores
A z-score is a unit of measurement used in statistics to describe the position of a raw score in terms of its distance from the mean, measured with reference to standard deviation from the mean. Z-scores are useful in statistics because they allow comparison between two scores that belong to different normal distributions.


Trending now
This is a popular solution!

Step by step
Solved in 2 steps with 2 images


