The following table presents the scores of students in Statistics examination Scores Frequency 30-39 2. 40-49 9. 09 140 50-59 70-79 184 80 - 89 135 66 06 What is the mean score of the students? Select the correct response.: 74.85 78.54 74.58 75.48
The following table presents the scores of students in Statistics examination Scores Frequency 30-39 2. 40-49 9. 09 140 50-59 70-79 184 80 - 89 135 66 06 What is the mean score of the students? Select the correct response.: 74.85 78.54 74.58 75.48

Glencoe Algebra 1, Student Edition, 9780079039897, 0079039898, 2018
18th Edition
ISBN:9780079039897
Author:Carter
Publisher:Carter
Chapter10: Statistics
Section10.5: Comparing Sets Of Data
Problem 1GP

Related questions
Question
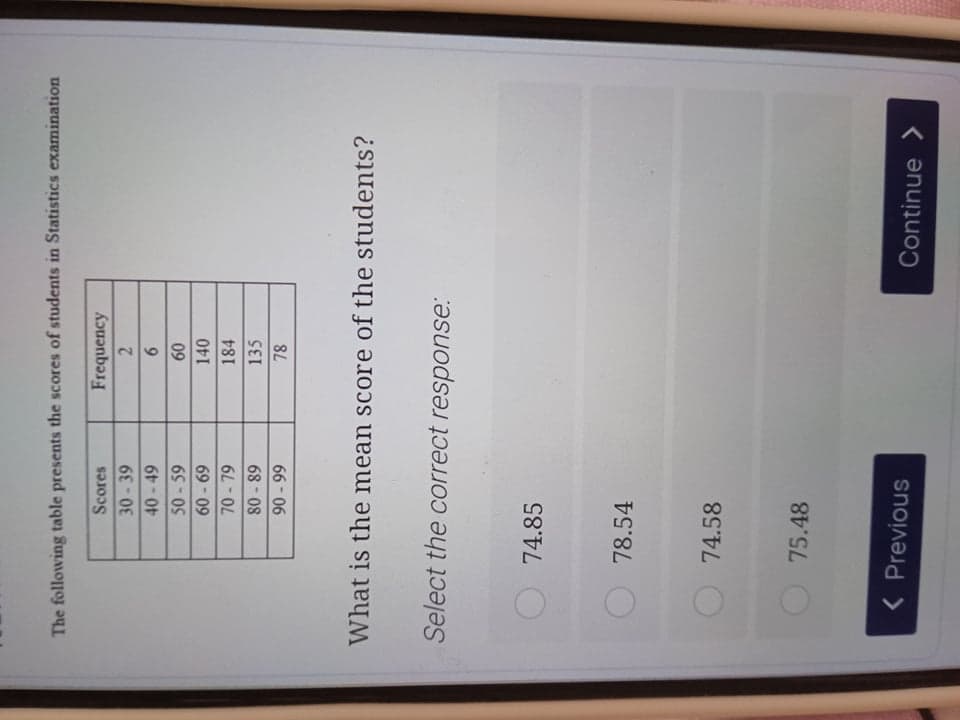
Transcribed Image Text:The following table presents the scores of students in Statistics examination
Scores
Frequency
30-39
2.
40-49
9.
09
140
50-59
60-69
70- 79
184
80 - 89
135
66 06
What is the mean score of the students?
Select the correct response:
74.85
78.54
74.58
75.48
< Previous
Continue >
Expert Solution
This question has been solved!
Explore an expertly crafted, step-by-step solution for a thorough understanding of key concepts.

Step by step
Solved in 2 steps

Recommended textbooks for you
Glencoe Algebra 1, Student Edition, 9780079039897…
Algebra
ISBN:
9780079039897
Author:
Carter
Publisher:
McGraw Hill
Glencoe Algebra 1, Student Edition, 9780079039897…
Algebra
ISBN:
9780079039897
Author:
Carter
Publisher:
McGraw Hill