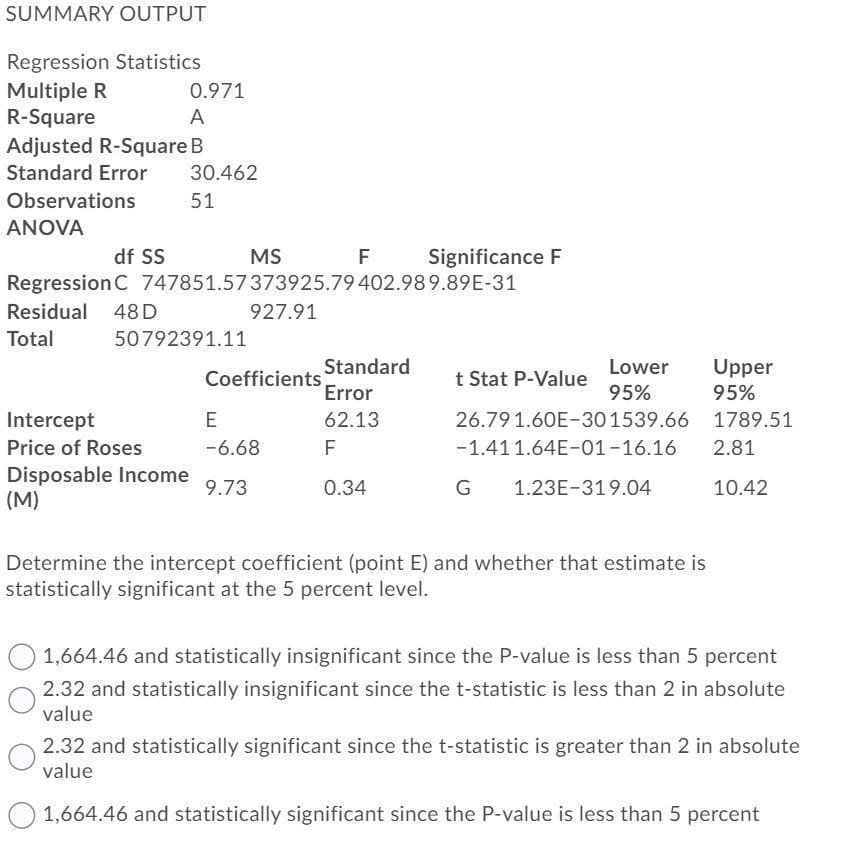
SUMMARY OUTPUT Regression Statistics Multiple R R-Square 0.971 A Adjusted R-Square B 30.462 Standard Error Observations 51 ANOVA Significance F Regression C 747851.57373925.79 402.989.89E-31 df SS MS F Residual 48 D 927.91 Total 50792391.11 Standard Lower Upper 95% Coefficients t Stat P-Value Error 95% Intercept E 62.13 26.79 1.60E-30 1539.66 1789.51 Price of Roses -6.68 F -1.411.64E-01-16.16 2.81 Disposable Income (M) 9.73 0.34 G 1.23E-319.04 10.42 Determine the intercept coefficient (point E) and whether that estimate is statistically significant at the 5 percent level.
SUMMARY OUTPUT Regression Statistics Multiple R R-Square 0.971 A Adjusted R-Square B 30.462 Standard Error Observations 51 ANOVA Significance F Regression C 747851.57373925.79 402.989.89E-31 df SS MS F Residual 48 D 927.91 Total 50792391.11 Standard Lower Upper 95% Coefficients t Stat P-Value Error 95% Intercept E 62.13 26.79 1.60E-30 1539.66 1789.51 Price of Roses -6.68 F -1.411.64E-01-16.16 2.81 Disposable Income (M) 9.73 0.34 G 1.23E-319.04 10.42 Determine the intercept coefficient (point E) and whether that estimate is statistically significant at the 5 percent level.

MATLAB: An Introduction with Applications
6th Edition
ISBN:9781119256830
Author:Amos Gilat
Publisher:Amos Gilat
Chapter1: Starting With Matlab
Section: Chapter Questions
Problem 1P

Related questions
Question
Transcribed Image Text:SUMMARY OUTPUT
Regression Statistics
Multiple R
R-Square
0.971
A
Adjusted R-Square B
Standard Error
30.462
Observations
51
ANOVA
F
Significance F
Regression C 747851.57373925.79402.989.89E-31
df SS
MS
Residual 48 D
927.91
Total
50792391.11
Standard
Lower
Upper
95%
Coefficients
t Stat P-Value
Error
95%
Intercept
E
62.13
26.79 1.60E-301539.66
1789.51
Price of Roses
-6.68
F
-1.411.64E-01-16.16
2.81
Disposable Income
(M)
9.73
0.34
G
1.23E-319.04
10.42
Determine the intercept coefficient (point E) and whether that estimate is
statistically significant at the 5 percent level.
1,664.46 and statistically insignificant since the P-value is less than 5 percent
2.32 and statistically insignificant since the t-statistic is less than 2 in absolute
value
2.32 and statistically significant since the t-statistic is greater than 2 in absolute
value
O 1,664.46 and statistically significant since the P-value is less than 5 percent
Expert Solution
This question has been solved!
Explore an expertly crafted, step-by-step solution for a thorough understanding of key concepts.

This is a popular solution!

Trending now
This is a popular solution!

Step by step
Solved in 2 steps with 1 images

Recommended textbooks for you
MATLAB: An Introduction with Applications
Statistics
ISBN:
9781119256830
Author:
Amos Gilat
Publisher:
John Wiley & Sons Inc

Probability and Statistics for Engineering and th…
Statistics
ISBN:
9781305251809
Author:
Jay L. Devore
Publisher:
Cengage Learning

Statistics for The Behavioral Sciences (MindTap C…
Statistics
ISBN:
9781305504912
Author:
Frederick J Gravetter, Larry B. Wallnau
Publisher:
Cengage Learning
MATLAB: An Introduction with Applications
Statistics
ISBN:
9781119256830
Author:
Amos Gilat
Publisher:
John Wiley & Sons Inc
Probability and Statistics for Engineering and th…
Statistics
ISBN:
9781305251809
Author:
Jay L. Devore
Publisher:
Cengage Learning
Statistics for The Behavioral Sciences (MindTap C…
Statistics
ISBN:
9781305504912
Author:
Frederick J Gravetter, Larry B. Wallnau
Publisher:
Cengage Learning

Elementary Statistics: Picturing the World (7th E…
Statistics
ISBN:
9780134683416
Author:
Ron Larson, Betsy Farber
Publisher:
PEARSON

The Basic Practice of Statistics
Statistics
ISBN:
9781319042578
Author:
David S. Moore, William I. Notz, Michael A. Fligner
Publisher:
W. H. Freeman

Introduction to the Practice of Statistics
Statistics
ISBN:
9781319013387
Author:
David S. Moore, George P. McCabe, Bruce A. Craig
Publisher:
W. H. Freeman