Ho: H₂ μl μ2=0 μl! = µ2 (b) Assume that experience with the satisfaction rating scale indicates that a population standard deviation of 14 is a reasonable assumption for both retailers. Conduct the hypothesis test. Calculate the test statistic. (Use #₁ - H₂. Round your answer to two decimal places.) 1.16 x X X Report the p-value. (Round your answer to four decimal places.) p-value=2460 X At a 0.05 level of significance what is your conclusion? O Reject Ho. There is sufficient evidence to conclude that the population mean satisfaction scores differ for the two retailers. Do not reject Ho. There is not sufficient evidence to conclude that the population mean satisfaction scores differ for the two retailers. O Reject Ho. There is not sufficient evidence to conclude that the population mean satisfaction scores differ for the two retailers. O Do not reject Ho. There is sufficient evidence to conclude that the population mean satisfaction scores differ for the two retailers. 65°F Mostly sunny (c) Which retailer, if either, appears to have the greater customer satisfaction? O Supermarket 1 O Supermarket 2 neither Need Help? Provide a 95% confidence interval for the difference between the population mean customer satisfaction scores for the two retailers. (Use x₁-x₂. Round your answers to two decimal places.) to Read It 6:38 PM D 10/9/2022
Ho: H₂ μl μ2=0 μl! = µ2 (b) Assume that experience with the satisfaction rating scale indicates that a population standard deviation of 14 is a reasonable assumption for both retailers. Conduct the hypothesis test. Calculate the test statistic. (Use #₁ - H₂. Round your answer to two decimal places.) 1.16 x X X Report the p-value. (Round your answer to four decimal places.) p-value=2460 X At a 0.05 level of significance what is your conclusion? O Reject Ho. There is sufficient evidence to conclude that the population mean satisfaction scores differ for the two retailers. Do not reject Ho. There is not sufficient evidence to conclude that the population mean satisfaction scores differ for the two retailers. O Reject Ho. There is not sufficient evidence to conclude that the population mean satisfaction scores differ for the two retailers. O Do not reject Ho. There is sufficient evidence to conclude that the population mean satisfaction scores differ for the two retailers. 65°F Mostly sunny (c) Which retailer, if either, appears to have the greater customer satisfaction? O Supermarket 1 O Supermarket 2 neither Need Help? Provide a 95% confidence interval for the difference between the population mean customer satisfaction scores for the two retailers. (Use x₁-x₂. Round your answers to two decimal places.) to Read It 6:38 PM D 10/9/2022

Holt Mcdougal Larson Pre-algebra: Student Edition 2012
1st Edition
ISBN:9780547587776
Author:HOLT MCDOUGAL
Publisher:HOLT MCDOUGAL
Chapter11: Data Analysis And Probability
Section11.4: Collecting Data
Problem 6E

Related questions
Question
Transcribed Image Text:esc
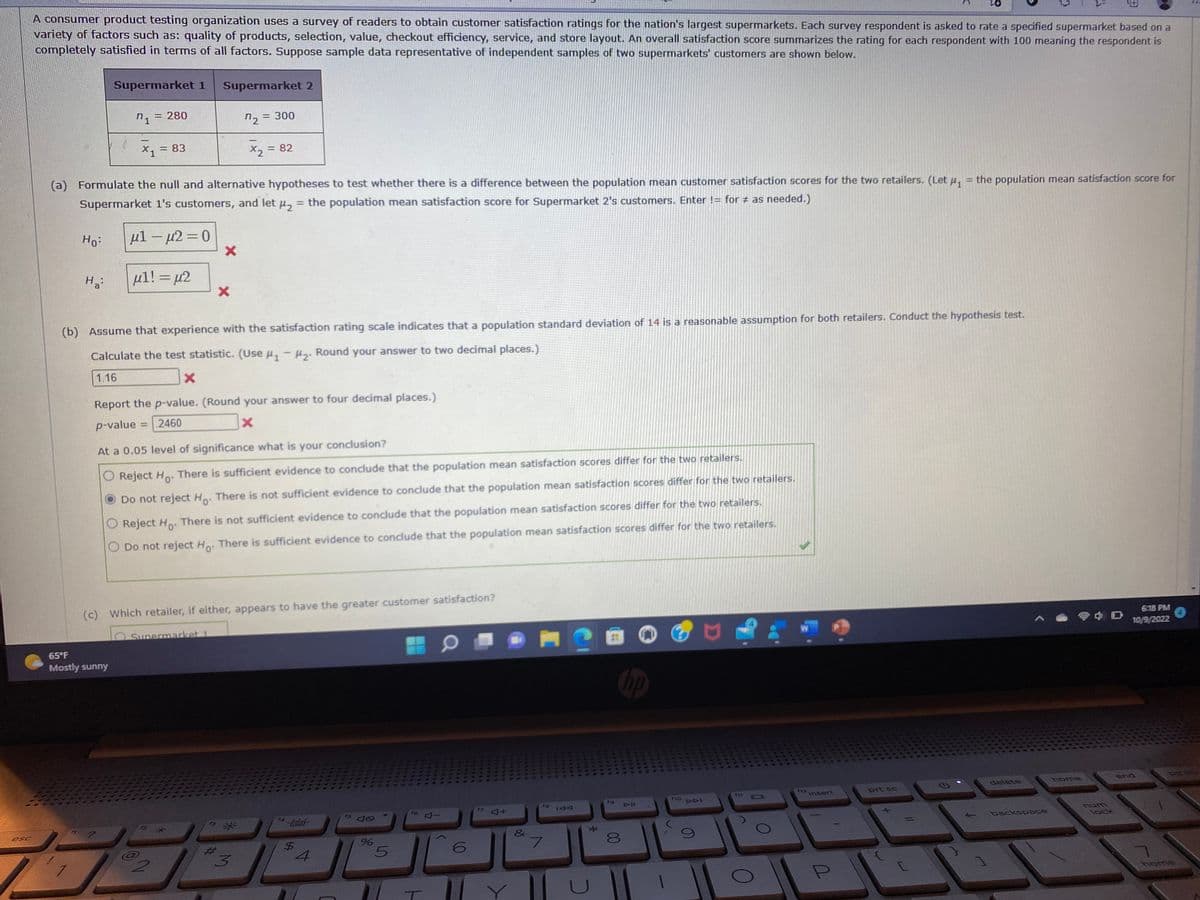
A consumer product testing organization uses a survey of readers to obtain customer satisfaction ratings for the nation's largest supermarkets. Each survey respondent is asked to rate a specified supermarket based on a
variety of factors such as: quality of products, selection, value, checkout efficiency, service, and store layout. An overall satisfaction score summarizes the rating for each respondent with 100 meaning the respondent is
completely satisfied in terms of all factors. Suppose sample data representative of independent samples of two supermarkets' customers are shown below.
Ho:
Ha
! 1
Supermarket 1
n1
(a) Formulate the null and alternative hypotheses to test whether there is a difference between the population mean customer satisfaction scores for the two retailers. (Let μ₁
Supermarket 1's customers, and let μ₂ = the population mean satisfaction score for Supermarket 2's customers. Enter != for # as needed.)
= 280
X1 = 83
65°F
Mostly sunny
μ1 – μ2 = 0
μ1! = μ2
Supermarket 2
X
(b) Assume that experience with the satisfaction rating scale indicates that a population standard deviation of 14 is a reasonable assumption for both retailers. Conduct the hypothesis test.
Calculate the test statistic. (Use #₁ - ₂. Round your answer to two decimal places.)
1.16
X
Report the p-value. (Round your answer to four decimal places.)
p-value=2460
X
Supermarket 1
2
At a 0.05 level of significance what is your conclusion?
Reject Ho. There is sufficient evidence to conclude that the population mean satisfaction scores differ for the two retailers.
Do not reject Ho. There is not sufficient evidence to conclude that the population mean satisfaction scores differ for the two retailers.
O Reject Ho. There is not sufficient evidence to conclude that the population mean satisfaction scores differ for the two retailers.
O Do not reject Ho. There is sufficient evidence to conclude that the population mean satisfaction scores differ for the two retailers.
72 = 300
x2 =
= 82
(c) Which retailer, if either, appears to have the greater customer satisfaction?
*
3
15 40
%
5
T
6
4+
&
7
IAA
*
8
hp
f10
DDI
f11
101
W
112
Insert
U
= the population mean satisfaction score for
prt sc
delete
backspace
home
D
lock
BE
6:18 PM
10/9/2022
end
DE UD
home
Transcribed Image Text:K
esc
Ho:
Ha
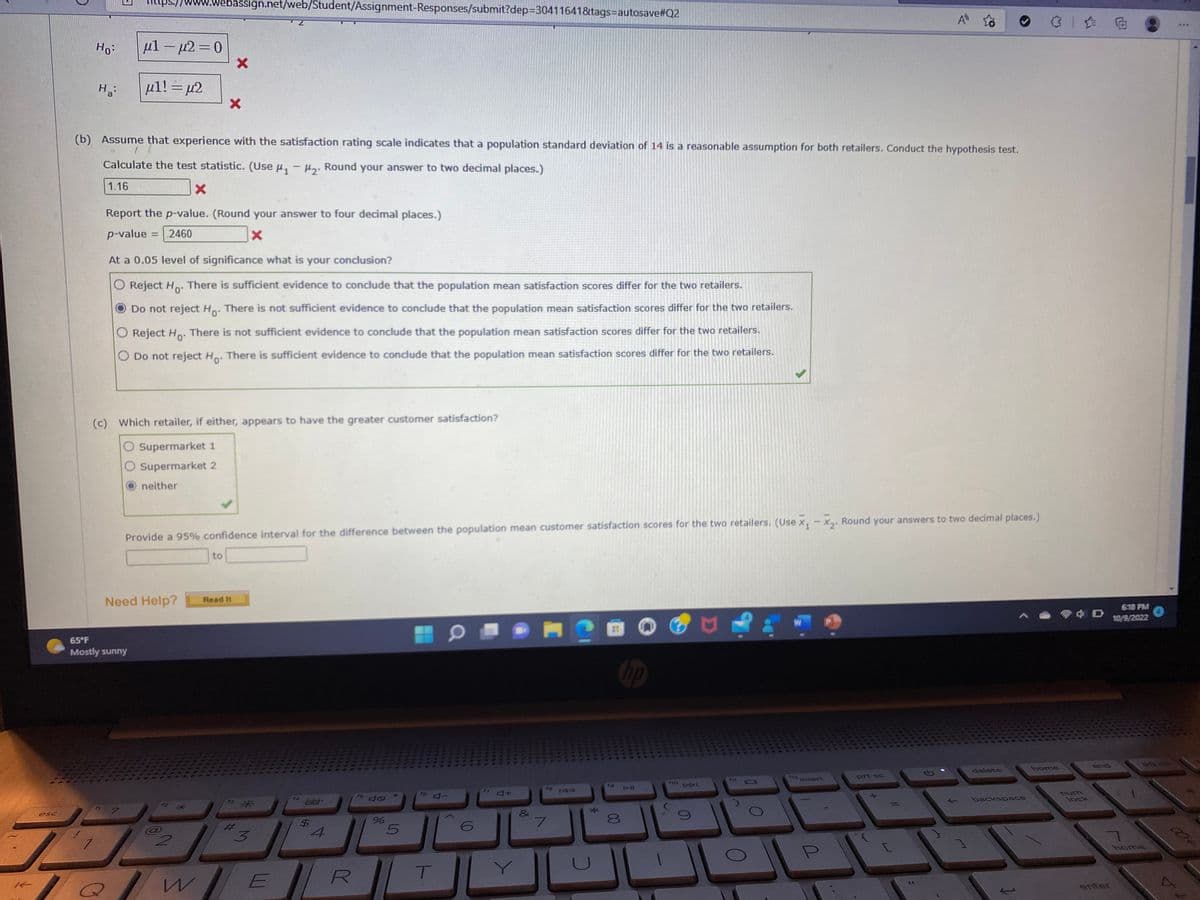
μl μ2=0
-
μl! = µ2
www.webassign.net/web/Student/Assignment-Responses/submit?dep=30411641&tags=autosave#Q2
-
65°F
Mostly sunny
(b) Assume that experience with the satisfaction rating scale indicates that a population standard deviation of 14 is a reasonable assumption for both retailers. Conduct the hypothesis test.
Calculate the test statistic. (Use H₁ - H₂. Round your answer to two decimal places.)
1.16
X
Report the p-value. (Round your answer to four decimal places.)
p-value
.2460
X
At a 0.05 level of significance what is your conclusion?
O Reject Ho. There is sufficient evidence to conclude that the population mean satisfaction scores differ for the two retailers.
Do not reject Ho. There is not sufficient evidence to conclude that the population mean satisfaction scores differ for the two retailers.
There is not sufficient evidence to conclude that the population mean satisfaction scores differ for the two retailers.
O Reject Ho
O Do not reject Ho. There is sufficient evidence to conclude that the population mean satisfaction scores differ for the two retailers.
neither
X
X
(c) Which retailer, if either, appears to have the greater customer satisfaction?
O Supermarket 1
O Supermarket 2
Need Help?
Provide a 95% confidence interval for the difference between the population mean customer satisfaction scores for the two retailers. (Use X₁ X₂. Round your answers to two decimal places.)
to
Read It
*
3
QWE
$
4
R
%
5
T
6
4+
&
16
7
IAA
*
to
hp
DIL
J
f10
DDI
F11
A
12 Insert
prt sc
delete
backspace
home
店面
lock
end
6:18 PM
10/9/2022
7
enter
IN
O
DO US
home
⠀
004
Expert Solution
This question has been solved!
Explore an expertly crafted, step-by-step solution for a thorough understanding of key concepts.

This is a popular solution!

Trending now
This is a popular solution!

Step by step
Solved in 4 steps with 4 images

Recommended textbooks for you
Holt Mcdougal Larson Pre-algebra: Student Edition…
Algebra
ISBN:
9780547587776
Author:
HOLT MCDOUGAL
Publisher:
HOLT MCDOUGAL

Glencoe Algebra 1, Student Edition, 9780079039897…
Algebra
ISBN:
9780079039897
Author:
Carter
Publisher:
McGraw Hill

College Algebra (MindTap Course List)
Algebra
ISBN:
9781305652231
Author:
R. David Gustafson, Jeff Hughes
Publisher:
Cengage Learning
Holt Mcdougal Larson Pre-algebra: Student Edition…
Algebra
ISBN:
9780547587776
Author:
HOLT MCDOUGAL
Publisher:
HOLT MCDOUGAL
Glencoe Algebra 1, Student Edition, 9780079039897…
Algebra
ISBN:
9780079039897
Author:
Carter
Publisher:
McGraw Hill
College Algebra (MindTap Course List)
Algebra
ISBN:
9781305652231
Author:
R. David Gustafson, Jeff Hughes
Publisher:
Cengage Learning
