How did the growth curve with LITTLE food compare with the normal population growth curve? How did the population growth curve with ABUNDANT food compare with the normal population growth curve?
How did the growth curve with LITTLE food compare with the normal population growth curve? How did the population growth curve with ABUNDANT food compare with the normal population growth curve?

Biology: The Unity and Diversity of Life (MindTap Course List)
14th Edition
ISBN:9781305073951
Author:Cecie Starr, Ralph Taggart, Christine Evers, Lisa Starr
Publisher:Cecie Starr, Ralph Taggart, Christine Evers, Lisa Starr
Chapter44: Population Ecology
Section: Chapter Questions
Problem 13SQ: Match each term with its most suitable description. _____ carrying capacity a. maximum rate or...

Related questions

Question
100%
How did the growth curve with LITTLE food compare with the normal population growth curve ? How did the population growth curve with ABUNDANT food compare with the normal population growth curve?
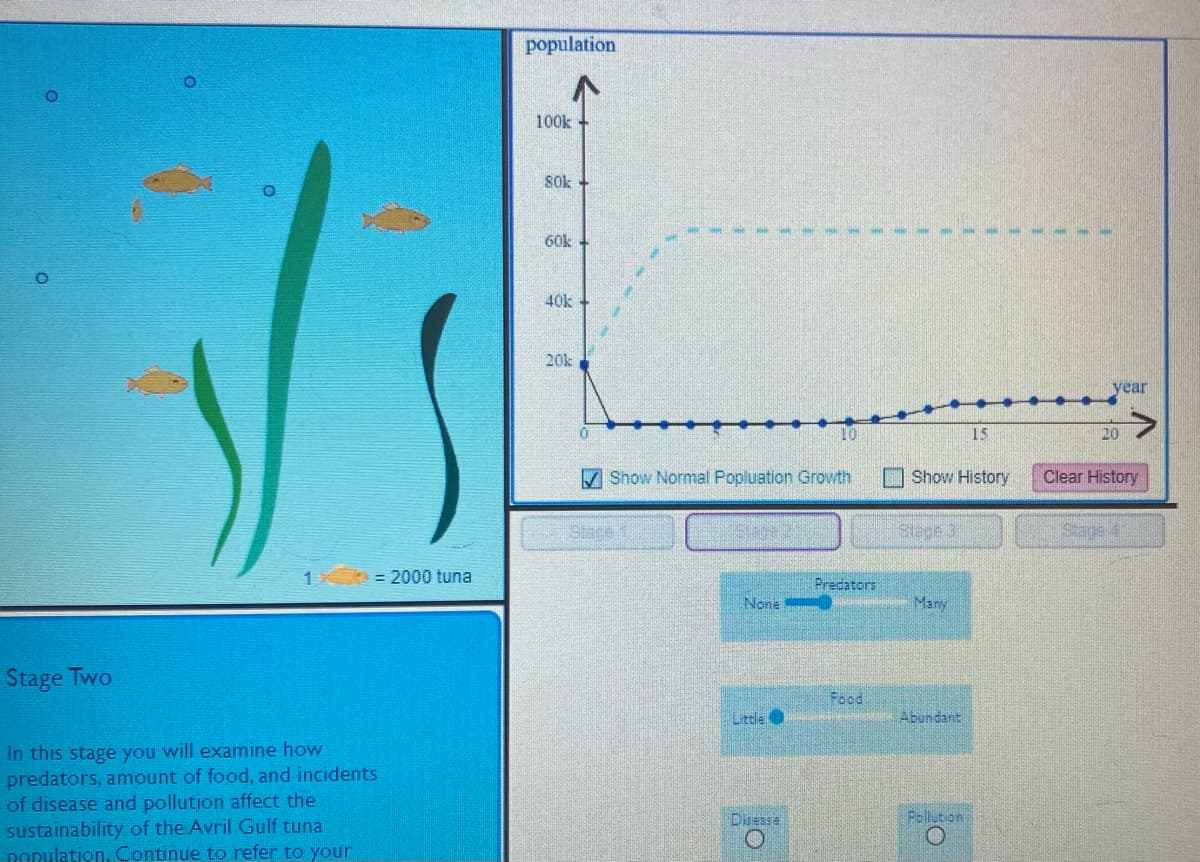
Transcribed Image Text:population
100k
Sok
60k +
40k
20k
vear
15
20
V Show Normal Popluation Grovth
OShow History
Clear History
Stege 3
Stage 4
= 2000 tuna
Predators
None
Many
Stage Two
Food
Lttle
Abundant
In this stage you will examine how
predators, amount of food, and incidents
of disease and pollution affect the
sustainability of the Avril Gulf tuna
DOpulation, Continue to refer to your
Disease
Pollution
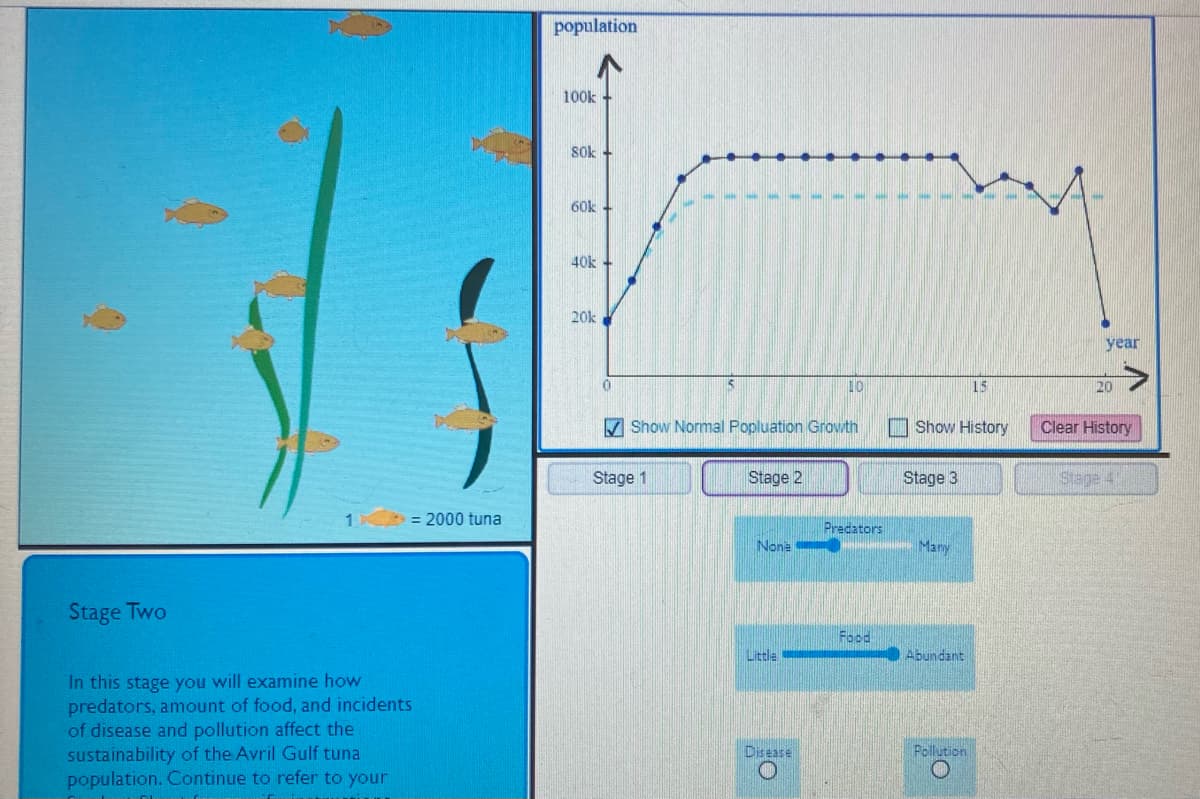
Transcribed Image Text:population
100k
Sok
60k
40k
20k
year
10
15
20
V Show Normal Popluation Growth
I Show History
Clear History
Stage 1
Stage 2
Stage 3
Stage 4
1 = 2000 tuna
Predators
None
Many
Stage Two
Food
Little
Abundant
In this stage you will examine how
predators, amount of food, and incidents
of disease and pollution affect the
sustainability of the Avril Gulf tuna
population. Continue to refer to your
Disease
Pollution
Expert Solution
This question has been solved!
Explore an expertly crafted, step-by-step solution for a thorough understanding of key concepts.

This is a popular solution!

Trending now
This is a popular solution!

Step by step
Solved in 2 steps

Knowledge Booster


Learn more about
Need a deep-dive on the concept behind this application? Look no further. Learn more about this topic, biology and related others by exploring similar questions and additional content below.Recommended textbooks for you
Biology: The Unity and Diversity of Life (MindTap…
Biology
ISBN:
9781305073951
Author:
Cecie Starr, Ralph Taggart, Christine Evers, Lisa Starr
Publisher:
Cengage Learning

Biology: The Unity and Diversity of Life (MindTap…
Biology
ISBN:
9781337408332
Author:
Cecie Starr, Ralph Taggart, Christine Evers, Lisa Starr
Publisher:
Cengage Learning

Biology Today and Tomorrow without Physiology (Mi…
Biology
ISBN:
9781305117396
Author:
Cecie Starr, Christine Evers, Lisa Starr
Publisher:
Cengage Learning
Biology: The Unity and Diversity of Life (MindTap…
Biology
ISBN:
9781305073951
Author:
Cecie Starr, Ralph Taggart, Christine Evers, Lisa Starr
Publisher:
Cengage Learning
Biology: The Unity and Diversity of Life (MindTap…
Biology
ISBN:
9781337408332
Author:
Cecie Starr, Ralph Taggart, Christine Evers, Lisa Starr
Publisher:
Cengage Learning
Biology Today and Tomorrow without Physiology (Mi…
Biology
ISBN:
9781305117396
Author:
Cecie Starr, Christine Evers, Lisa Starr
Publisher:
Cengage Learning

Biology 2e
Biology
ISBN:
9781947172517
Author:
Matthew Douglas, Jung Choi, Mary Ann Clark
Publisher:
OpenStax