
Biology 2e
2nd Edition
ISBN:9781947172517
Author:Matthew Douglas, Jung Choi, Mary Ann Clark
Publisher:Matthew Douglas, Jung Choi, Mary Ann Clark
Chapter24: Fungi
Section: Chapter Questions
Problem 20RQ: Yeast is a facultative anaerobe. This means that alcohol fermentation takes place only if: the...

Related questions

Question
On the last page of the document I've attached a picture of the data collected. You can see five values (height of bubbles in mm) in each box. That is because my class was divided into five groups that each collected that data. The results become more valid when the data from multiple groups is averaged.
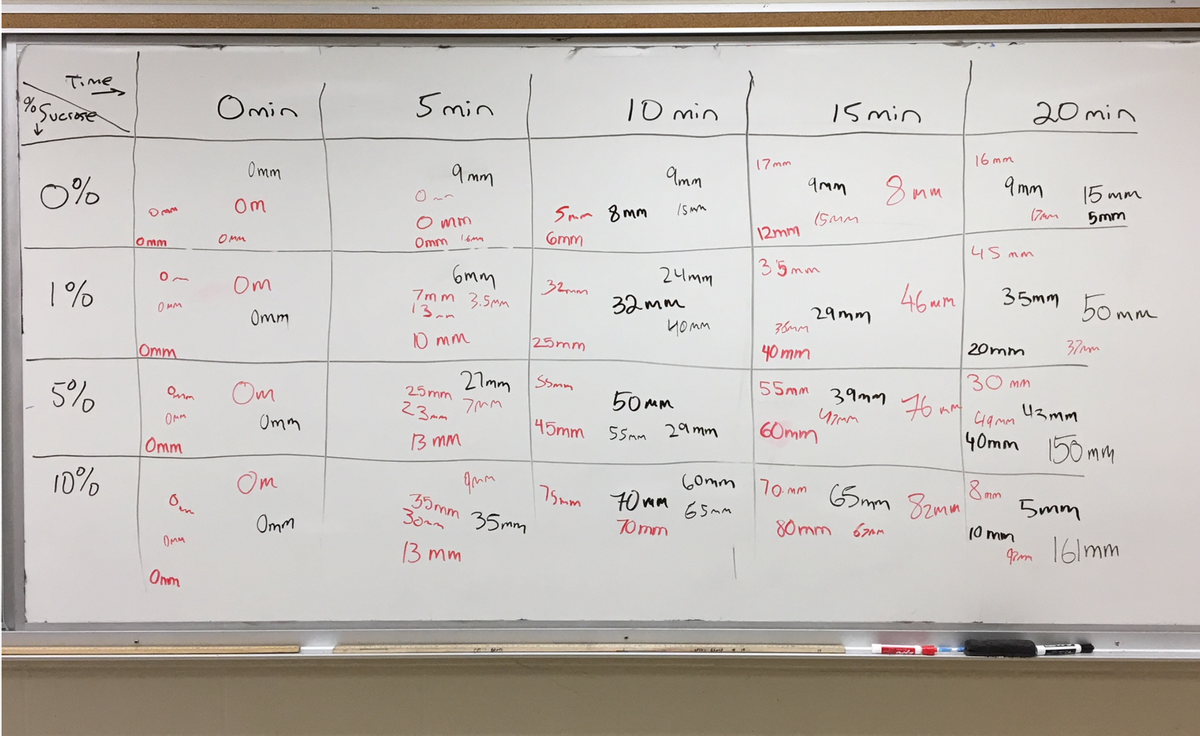
Transcribed Image Text:Time
%
90 Sucrose
0%
1%
5%
10%
0mm
0μm
Omm
Омм
Omm
0₂
Омм
Omm
Omin
0mm
Om
омм
Om
Omm
Om
Umm
От
Omm
5 min
9mm
0 mm
Отт 16 ми
6mm
7mm 3.5mm
13mm
10 mm
25mm
23mm
13 mm
qmm
35mm 35mm
30mm
13 mm
5mm 8mm
6mm
32mm
25mm
27mm 55mm
7mm
10 min
45mm
9mm
15mm
24mm
32mm
номи
50mm
55mm 29mm
75mm 70 mm
17mm
70 mm 65mm
70mm
9mm
15 min
15mm
12mm
35mm
29mm
36mm
40mm
55mm
60mm
8mm
46mm
39mm 76
47mm
KM
60mm 70 mm 65mm 82mm
80mm 67mm
16mm
9mm
20 min
45mm
17mm
15mm
5mm
35mm 50mm
10mm
20mm
30 mm
43mm
49mm
40mm 150mm
8mm
37mm
5mm
97m 161mm
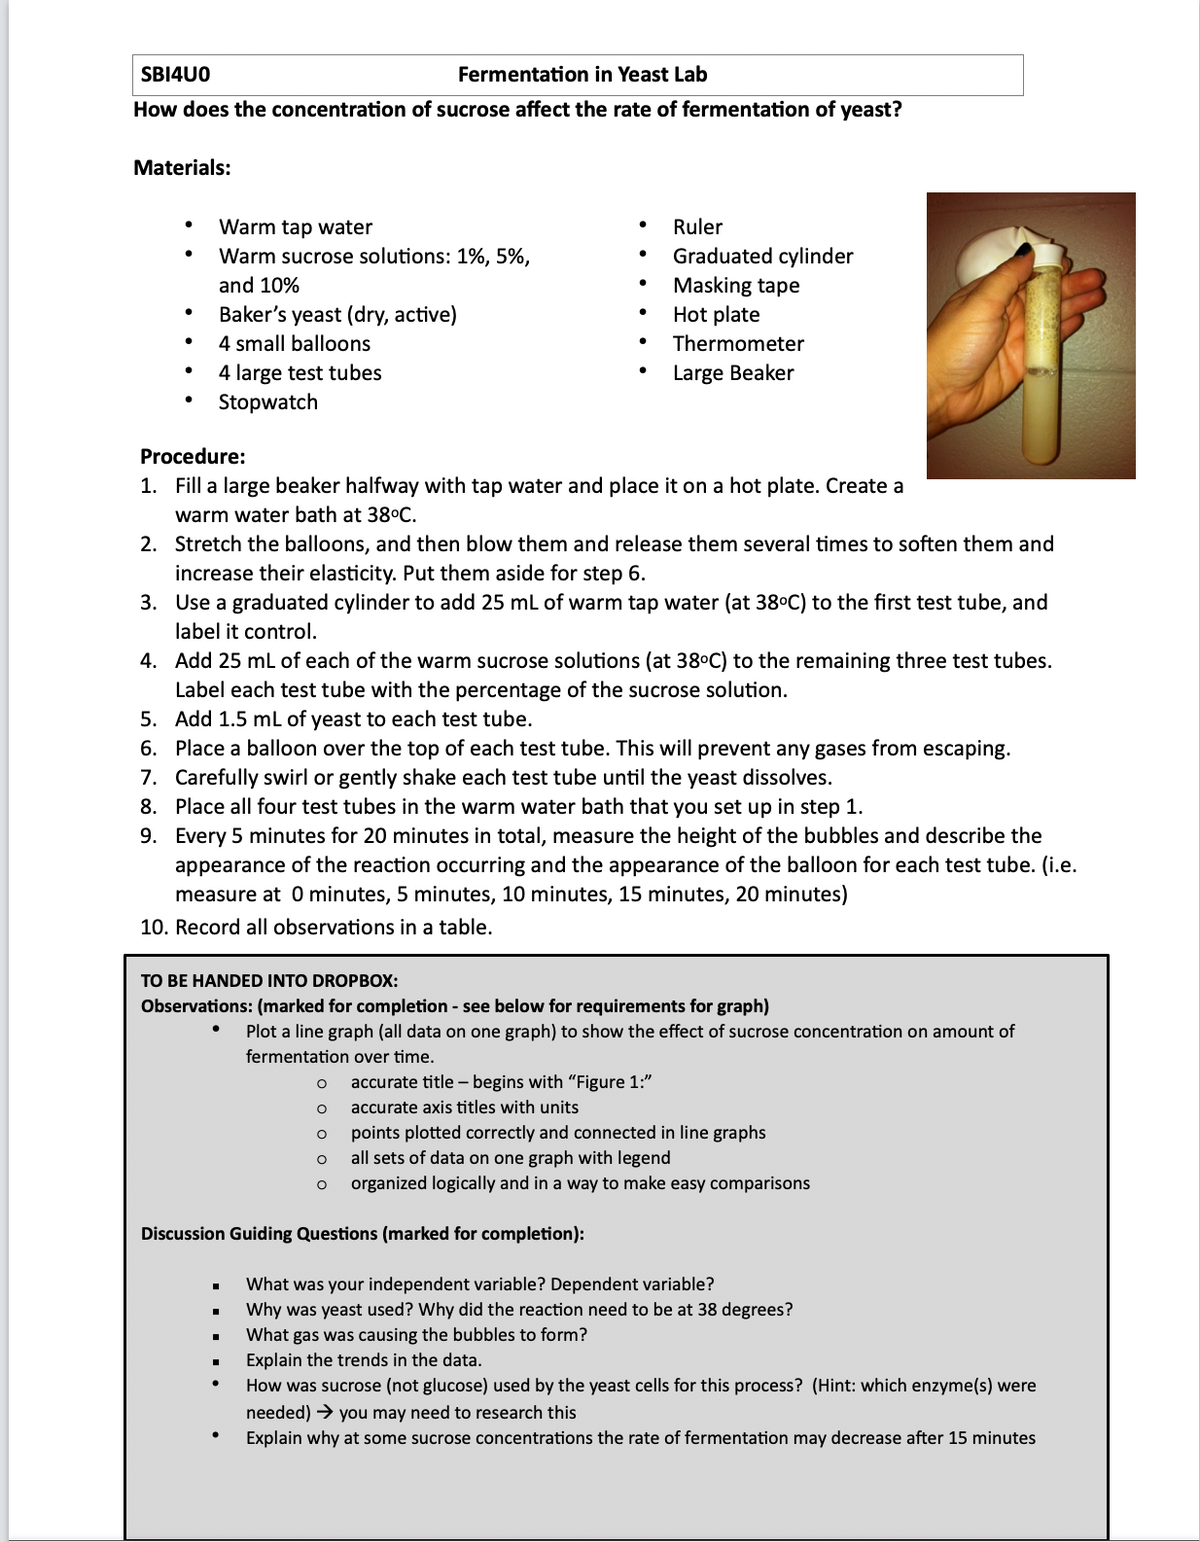
Transcribed Image Text:SBI4U0
Fermentation in Yeast Lab
How does the concentration of sucrose affect the rate of fermentation of yeast?
Materials:
●
Warm tap water
Warm sucrose solutions: 1%, 5%,
and 10%
Baker's yeast (dry, active)
4 small balloons
4 large test tubes
Stopwatch
Procedure:
1.
Fill a large beaker halfway with tap water and place it on a hot plate. Create a
warm water bath at 38°C.
2. Stretch the balloons, and then blow them and release them several times to soften them and
increase their elasticity. Put them aside for step 6.
3.
Use a graduated cylinder to add 25 mL of warm tap water (at 38°C) to the first test tube, and
label it control.
4. Add 25 mL of each of the warm sucrose solutions (at 38°C) to the remaining three test tubes.
Label each test tube with the percentage of the sucrose solution.
5. Add 1.5 mL of yeast to each test tube.
6. Place a balloon over the top of each test tube. This will prevent any gases from escaping.
7. Carefully swirl or gently shake each test tube until the yeast dissolves.
8.
Place all four test tubes in the warm water bath that you set up in step 1.
9. Every 5 minutes for 20 minutes in total, measure the height of the bubbles and describe the
appearance of the reaction occurring and the appearance of the balloon for each test tube. (i.e.
measure at 0 minutes, 5 minutes, 10 minutes, 15 minutes, 20 minutes)
10. Record all observations in a table.
TO BE HANDED INTO DROPBOX:
Observations: (marked for completion - see below for requirements for graph)
■
■
●
Ruler
Graduated cylinder
Masking tape
Hot plate
Thermometer
Large Beaker
●
Plot a line graph (all data on one graph) to show the effect of sucrose concentration on amount of
fermentation over time.
o o o o o
Discussion Guiding Questions (marked for completion):
accurate
accurate axis titles with units
title - begins with "Figure 1:"
points plotted correctly and connected in line graphs
all sets of data on one graph with legend
organized logically and in a way to make easy comparisons
What was your independent variable? Dependent variable?
Why was yeast used? Why did the reaction need to be at 38 degrees?
What gas was causing the bubbles to form?
Explain the trends in the data.
How was sucrose (not glucose) used by the yeast cells for this process? (Hint: which enzyme(s) were
needed) → you may need to research this
Explain why at some sucrose concentrations the rate of fermentation may decrease after 15 minutes
Expert Solution
This question has been solved!
Explore an expertly crafted, step-by-step solution for a thorough understanding of key concepts.

Step by step
Solved in 3 steps

Knowledge Booster


Learn more about
Need a deep-dive on the concept behind this application? Look no further. Learn more about this topic, biology and related others by exploring similar questions and additional content below.Recommended textbooks for you
Biology 2e
Biology
ISBN:
9781947172517
Author:
Matthew Douglas, Jung Choi, Mary Ann Clark
Publisher:
OpenStax

Biology 2e
Biology
ISBN:
9781947172517
Author:
Matthew Douglas, Jung Choi, Mary Ann Clark
Publisher:
OpenStax