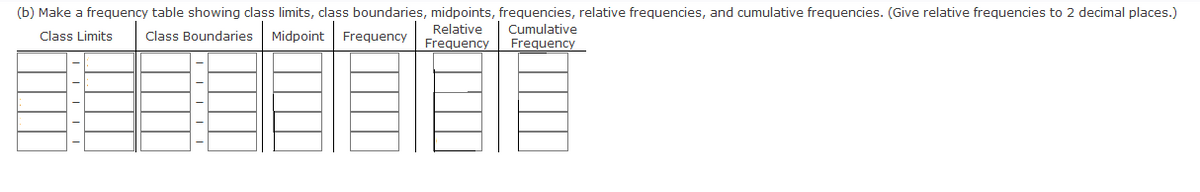
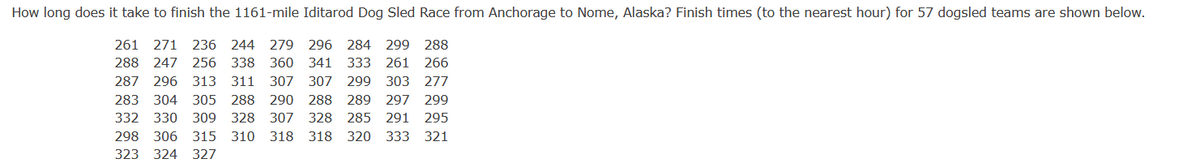
How long does it take to finish the 1161-mile Iditarod Dog Sled Race from Anchorage to Nome, Alaska? Finish times (to the nearest hour) for 57 dogsled teams are shown below. For this problem, use five classes. (b) Make a frequency table showing class limits, class boundaries, midpoints, frequencies, relative frequencies, and cumulative frequencies. (Give relative frequencies to 2 decimal places.) (e) Categorize the basic distribution shape. (choices are below) a. skewed left b. mound-shaped symmetrical c. bimodal d. skewed right e. uniform (f) Draw an ogive.


How long does it take to finish the 1161-mile Iditarod Dog Sled Race from Anchorage to Nome, Alaska? Finish times (to the nearest hour) for 57 dogsled teams are shown below.
For this problem, use five classes.
(e) Categorize the basic distribution shape. (choices are below)
Important Keys :
- Frequency
The number of times a certain value or class of values occurs.
- Frequency Distribution
The organization of raw data in table form with classes and frequencies.
- Grouped Frequency Distribution
A frequency distribution where several numbers are grouped into one class.
- Class Limits
Separate one class in a grouped frequency distribution from another. The limits could actually appear in the data and have gaps between the upper limit of one class and the lower limit of the next.
- Class Boundaries
Separate one class in a grouped frequency distribution from another. The boundaries have one more decimal place than the raw data and therefore do not appear in the data. There is no gap between the upper boundary of one class and the lower boundary of the next class. The lower class boundary is found by subtracting 0.5 units from the lower class limit and the upper class boundary is found by adding 0.5 units to the upper class limit.
- Class Width
The difference between the upper and lower boundaries of any class. The class width is also the difference between the lower limits of two consecutive classes or the upper limits of two consecutive classes. It is not the difference between the upper and lower limits of the same class.
- Class Mark (Midpoint)
The number in the middle of the class. It is found by adding the upper and lower limits and dividing by two. It can also be found by adding the upper and lower boundaries and dividing by two.
- Cumulative Frequency
The number of values less than the upper class boundary for the current class. This is a running total of the frequencies.
- Relative Frequency
The frequency divided by the total frequency. This gives the percent of values falling in that class.
- Histogram
A graph which displays the data by using vertical bars of various heights to represent frequencies. The horizontal axis can be either the class boundaries, the class marks, or the class limits.
- Ogive
A frequency polygon of the cumulative frequency or the relative cumulative frequency. The vertical axis the cumulative frequency or relative cumulative frequency. The horizontal axis is the class boundaries. The graph always starts at zero at the lowest class boundary and will end up at the total frequency (for a cumulative frequency) or 1.00 (for a relative cumulative frequency).

Trending now
This is a popular solution!

Step by step
Solved in 5 steps with 2 images


