
Mathematics For Machine Technology
8th Edition
ISBN:9781337798310
Author:Peterson, John.
Publisher:Peterson, John.
Chapter87: An Introduction To G- And M-codes For Cnc Programming
Section: Chapter Questions
Problem 16A

Related questions

Question
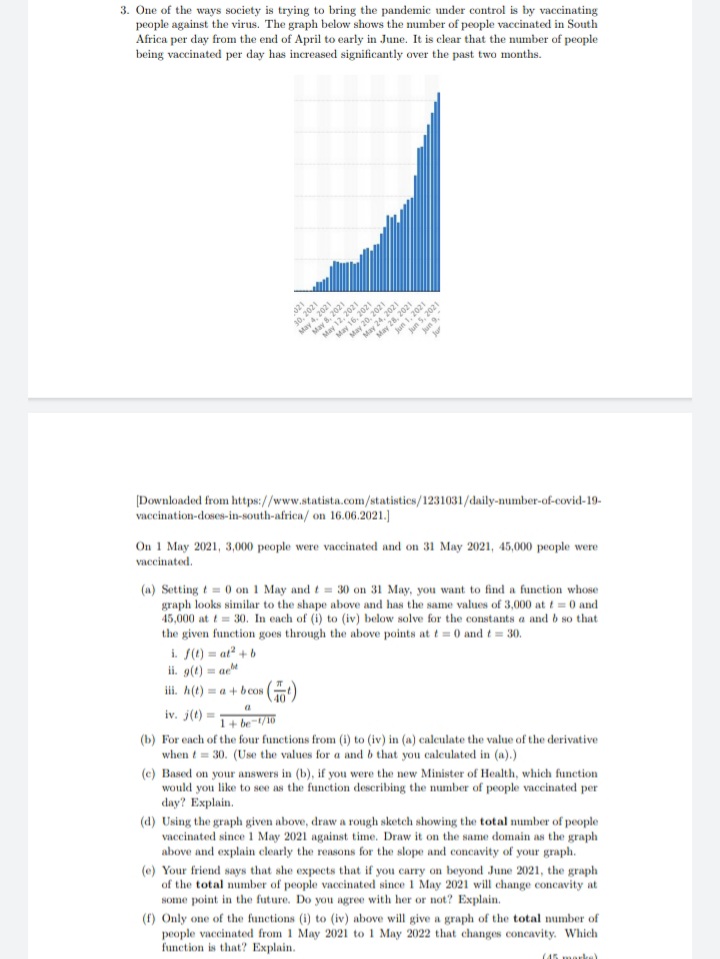
Transcribed Image Text:3. One of the ways society is trying to bring the pandemic under control is by vaccinating
people against the virus. The graph below shows the number of people vaccinated in South
Africa per day from the end of April to early in June. It is clear that the number of people
being vaccinated per day has increased significantly over the past two months.
021
30, 2021
Jur
(Downloaded from https://www.statista.com/statistics/1231031/daily-number-of-covid-19-
vaccination-doses-in-south-africa/ on 16.06.2021.)
On 1 May 2021, 3,000 people were vaccinated and on 31 May 2021, 45,000 people were
vaccinated.
(n) Setting t = 0 on 1 May and t= 30 on 31 May, you want to find a function whose
graph looks similar to the shape above and has the same values of 3,000 at t= 0 and
45,000 at t = 30. In each of (i) to (iv) below solve for the constants a and b so that
the given function goes through the above points at t = 0 and t = 30.
i. f(1) = at? + b
ii. 9(t) = ae
iii. A(t) = a + bcos
iv. j(t)
1+ be-/0
(b) For each of the four functions from (i) to (iv) in (a) caleulate the value of the derivative
when t = 30. (Use the values for a and b that you calculated in (a).)
(c) Based on your answers in (b), if you were the new Minister of Health, which function
would you like to see as the function describing the number of people vaccinated per
day? Explain.
(d) Using the graph given above, draw a rough sketch showing the total number of people
vaccinated since 1 May 2021 against time. Draw it on the same domain as the graph
above and explain clearly the reasons for the slope and concavity of your graph.
(e) Your friend says that she expects that if you carry on beyond June 2021, the graph
of the total number of people vaccinated since 1 May 2021 will change concavity at
some point in the future. Do you agree with her or not? Explain.
(f) Only one of the functions (i) to (iv) above will give a graph of the total number of
people vaccinated from 1 May 2021 to 1 May 2022 that changes concavity. Which
function is that? Explain.
(45 marka)
May 4, 2021
May 8, 2021
May 12, 2021
May 16, 2021
May 20, 2021
May 24, 2021
May 28, 2021
Jun 1, 2021
Jun 5, 2021
Jun 9,
Expert Solution
This question has been solved!
Explore an expertly crafted, step-by-step solution for a thorough understanding of key concepts.

Step by step
Solved in 3 steps with 2 images

Knowledge Booster


Learn more about
Need a deep-dive on the concept behind this application? Look no further. Learn more about this topic, calculus and related others by exploring similar questions and additional content below.Recommended textbooks for you
Mathematics For Machine Technology
Advanced Math
ISBN:
9781337798310
Author:
Peterson, John.
Publisher:
Cengage Learning,
Mathematics For Machine Technology
Advanced Math
ISBN:
9781337798310
Author:
Peterson, John.
Publisher:
Cengage Learning,