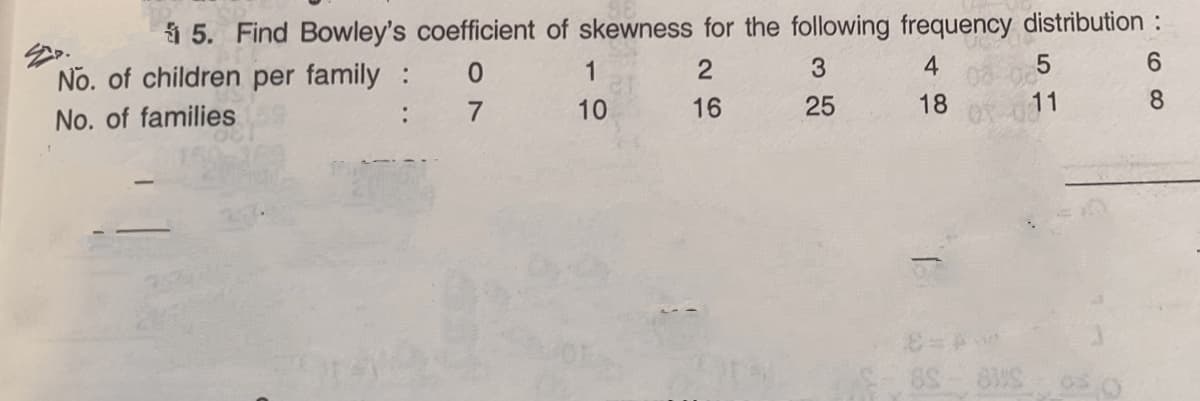
i 5. Find Bowley's coefficient of skewness for the following frequency distribution : No. of children per family : 0. 1 3 4 6. No. of families : 7 10 16 25 18 11 8.


Q: Find the Bowley's coefficient of skewness for the following frequency distribution: No. of chidren…
A: Given data is No. of children per family(x) 0 1 2 3 4 5 6 No. of families(f) 7 10 16 25 18 11 8…
Q: (a) Find Bowley's coefficient of skewness for the following frequency distribution:- No. of children…
A: Given: No. of children per family No. of families 0 7 1 10 2 16 3 25 4 18 5 41 6 8
Q: Q2) Draw a Histogram & Frequency Polygon for the given data. Class 10 – 19 20 - 29 30 - 39 40 - 49…
A: Given : Class Intervals Frequency 11-19 7 20-29 13 30-39 22 40-49 11 50-59 6 60-69…
Q: For the following grouped data find the frequency fi, class mid-point x; and the |Меan y ? 12 23 10…
A: Reviewing the information, given grouped data,
Q: H.W: The frequency distribution below shows the heights (in cm) of 50 st a certain high school…
A: Since you have posted a question with multiple sub-parts, we have answered first 3 sub-parts. Please…
Q: 3 The heights, in cm, of 32 female gymnasts were recorded: 148 152 147 149 150 147 151 142 156 148…
A: The given data of 32 females gymnasts height 148 152 147 149 150 147 151 142 156…
Q: he results are shown in the table below: Number of Bicycles Frequency 15 1 30 20 3 15 4 15 What is…
A: We have given that, x :- 0 1 2 3 4 5 f :- 15 30 20 15 15 6…
Q: Use the side-by-side boxplots shown to complete parts (a) through (e). y 30 60 90 120 (a) What is…
A: We have to find correct option.
Q: Q1: For the following grouped data find the frequency fi , class mid-point x; and the Mean y ? 12 23…
A: We will have to find group, frequency fi, class mid-point xi . Here we make class of length 10. The…
Q: ind the mean of the data summarized in the given frequency distribution. Compare the computed mean…
A: Solution: The given data is inclusive. To make this as exclusive the value d/2 should be added to…
Q: 2 For the following data, state whether a frequency histogram or a column graph should be used, and…
A: Data can be organized graphically for interpretation in a single glance in Statistics. The two forms…
Q: If 500 consumers were surveyed, give the frequency distribution for these data
A: b): if N=500 consumers were surveyed then frequency distribution of the data will be ?
Q: QI For the next frequency table, if (X =28.5) the Standard deviation (S) is : * Xi 15 19 23 27 31 35…
A: The mean is given as 28.5. The following table gives the squared deviations from the mean value.
Q: The following frequency histogram represents the IQ scores of a random sample of seventh-grade…
A: We want to find the number of sampled and determine class width.
Q: Find Bowley's coefficient of skewness for the following frequency distribution: No. of children per…
A: Solution:
Q: (a) Construct a frequency distribution. Blood Type Frequency A 19 АВ 3 B 7 21 (Type whole numbers.)…
A:
Q: Develop the frequency table of the data From the frequency table, calculate each of the following…
A: [Disclaimer: Since, you have asked multipart question, we will solve the first three sub part for…
Q: (e) Determine the z-score of the second lowest and the second highest grades among the population.…
A: Given data, Data 23 60 79 32 57 74 52 70 82 36 80 77 81 95 41 65…
Q: Calculate skewness from the following distribution. 6 x : 1 3 4 5 7 f:. 12 27 29 19 8 4 1
A:
Q: Q1: For the following grouped data find the frequency fi, class mid-point X; and the Mean y ? 12 23…
A: For the following we will find group, frequency and class mid-poin xi as, Group Frequency fi…
Q: 10+ 13 16 19 10 data Based on the histogram above, what is the frequency of the cass containing the…
A: The frequence of the class containing the value 17 is
Q: a) The following frequency distribution shows the 50 objects of masses measured nearest to grams.…
A: Draw a histogram for the given data: EXCEL software is used to draw the histogram. Software…
Q: d. By using the frequency distribution table find the Central Tendency Measurements of the student’s…
A:
Q: Consider a sample of 125 insurance policies from a portfolio of a general insurance company. The…
A: We want to calculate the coefficient of skewness of the data
Q: Q.No.1. Take 40 numbers randomly and find its i. a. P75, Q3 Median, Q,„D.P: Make a grouped frequency…
A: Given information is appropriate for measures of central tendency and measures of dispersion.…
Q: Which of the following is true about the range? a. measure of central tendency O b. measure of…
A: The study is about the range.
Q: 2 The number of goals scored in 25 female hockey matches is as follows: 0314 2 3 4 0 1 0526 3 13 3 2…
A: a) First table represents the scores of female players and second table represents the score of male…
Q: 1. The following are final score grades and the frequency table of the grades. What frequency must…
A: Given Data : We know that the frequency represents how many times a particular number appears in…
Q: Which of the following summary measures is affected by extreme values? Select one: a. The median.…
A: Range can be calculated as: Range =Maximum value - minimum value
Q: Q3) Pre-cast factory which produce different lengths of beams as follows: Length of beams Freq. 3.3…
A:
Q: Find a quadratic mean for the :following data Class Frequency Intervals 2.30-2.39
A: The quadratic mean is also called as root mean square. This is one of the types of average, based on…
Q: Q3): In a factory for the production of pre-cast beams, which have different lengths as shown in…
A: A frequency distribution is a tabular, listed or graphical representation of data that shows the…
Q: If the range of a given dataset(of quiz score) is 32 and and the desired number of classes is 7,…
A:
Q: The missing frequency of the following table will be Frequency Distribution Class Interval Frequency…
A: Given that The frequency table To find the missing value x
Q: What is the relative frequency of the mode? * Data Points frequency 1.2 4.8 8 8.4 30 12.0 15.6 O…
A: We will find out the required value.
Q: Q: Below are the data for the grades of a simple of students in the final examination of the…
A: Note: "Since you have posted a question with multiple sub-parts, we will solve the first three…
Q: a) Define the type of the data b) Create the frequency, relative frequency table, and a histogram…
A: NOTE: Since there are multiple subparts we have solved the first three subparts for you. To get the…
Q: (a) Find Bowley's coefficient of skewness for the following frequency distribution:– 1 2 3 5 6 No.…
A:
Q: Q2: the following frequency table represent the wages for group of employees per week in JD Mid…
A: Joint distribution is defined as the probability distribution having two or more independent random…
Q: Complete the relative frequency distribution below. Relative Cause Frequency 9.3 % Pilot error Other…
A:
Q: A 17. Complete the final two columns in the following frequency distribution table and then find the…
A: Cumulative frequency and Cumulative percentage: Cumulative frequencies are obtained by adding each…
Q: 31. Calculate Coefficient of Concurrent Deviation from the following data: X: 1 2. 3 4. 5. Y: 25 16…
A:
Q: From the Previous example in Lec.5 Find: 1- The median 2- The Mode 3- The relative Frequency…
A: Mean, median, mode, etc are the different types of average. The average is the single value that…
Q: 1. The distance travelled (in kilometres) by a courier service motorcycle on 40 trips were recorded…
A:
Q: Q1. (a) Define frequency distributions.
A: The objective is to find highest grade ,lowest grade ,range. we have given data of sample points…
Q: 云2 * 00 < CO T R 20 Question 38 The boxplot below shows salaries for Construction workers and…
A: Boxplot: The box plot represents the statistical data based on the five number summary, minimum,…
Q: 8. The following data gives values for the fuel used to heat a house for a month, and the number of…
A: Note: Since you have posted a question with multiple subparts, we will solve the first three…
Q: Refer to the following frequency distribution on days absent during a calendar year by employees of…
A:
Q: The following are the raw score for the 90-item examination in Statistics of the 50 students in 10th…
A: Note: Since, we only answer up to 3 sub-parts, we'll answer the first 3. Please resubmit the…
Q: Given a data set with и 3D 18 аnd o — find the percent of data within each range: Just type the…
A: As per company guidelines I solved exactly three subparts of the question.thank you

Step by step
Solved in 2 steps with 2 images
